Reference no: EM132545996
Question 1. Consider the following two-country model with specific factor being capital in both X-sector and Y-sector but labor is mobile between two sectors. Assume X is more capital-intensive good than Y. And assume Home country is more labor abundant than Foreign country. Therefore, Home country exports Y good and imports X good while Foreign country exports X good and imports Y good. So Heckscher -Ohlin theorem applies but capital is fixed and sector-specific. Home country's capital is K and K= Kx +Ky and Foreign country's capital is K* and K*=Kx* +Ky*. Assume that all capitals (Kx, Ky, Kx*, Ky*) are sector-specific and therefore cannot move between sectors.
Consider demand for labor curves (Value of Marginal Product of Labor(VMPL)
curves) in X industry and Y industry are as follows:
W = 100 - Lx and W= 100 - Ly L= 100 =Lx +Ly
where W = wage rate and L =total labor in Home Country and Lx =labor hired in X industry and Ly = labor hired in Y industry
Figure 5.2 in the textbookis copied below where horizontal line is Total Labor Supply in Home Country and vertical lines are wage level (W) in X industry on the left-hand side and wage level in Y industry on the right-hand side.
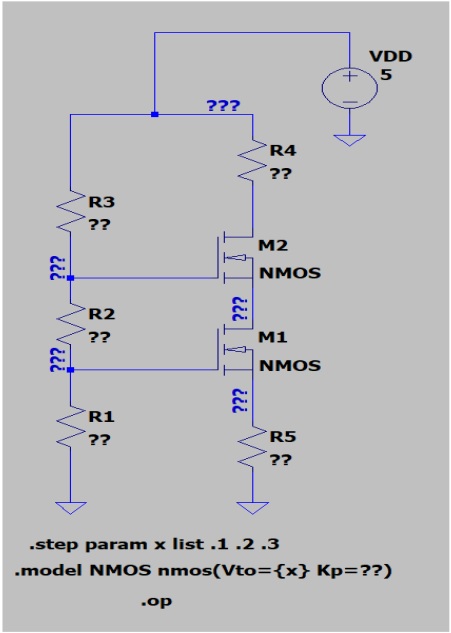
(a) Solve for autarky equilibrium level of labor at X industry (Lx) and Y industry (Ly); Lx=____________ Ly=_______________
(b) Find out the equilibrium wage level (W*) under autarky at both X and Y industry: W* = _______________________
(c) Suppose now free trade is made between Home country and Foreign country and therefore, Home country (relatively more labor-abundant country)will export Y-good (more labor intensive good) and face higher relative price of good Y with respect to price of good X (Py /Px). That will make VMPL for Y (labor-intensive good) to "shift up". Assume that such shift-up occurs as follows:W= 120 - Ly
Then what is new equilibrium level of labor in X industry (Lx') and Y industry(Ly') and wage rate (W')?:
Lx'=_________ Ly'=__________ W'=_____________
(d) The movement from autarky to free trade like (c) has differential impacts on income distribution.Who gets most favored income distribution in home country? Choose one from below: ___________________
(1)Owner of specific capital in industry X (Kx)
(2)Owner of specific capital in industry Y(Ky)
(3)Laborer in industry X (Lx)
(4)Laborer in industry Y (Ly)
(e) Suppose the amount of specific capital (Kx) in good X industry has been increased by foreign capital inflow into Hone country's X industry and therefore has made the industry's labor demand curve "shif-up" as: W = 120 - Lx
What is the new level of wage rate in home country? W*=______________________
Who gets most favored income distribution? Choose one from (d)________________
Question 2. Consider the following example of a tariff policy by a small open economy on individual product:
Domestic Demand curve: P = 100 - Q
Domestic Supply curve: P = 20 + Q
International market price: P* = 40
Tariff Rate imposed = 20 %
Figure 10.1in the textbook is copied below:
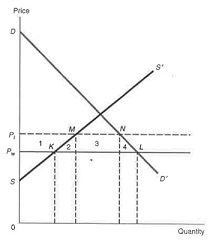
(a) Find out before-tariff quantity of import under free trade. Q=_______________
(b) Estimate the reduction in consumer surplus when this small country moves from free trade to 20% tariff imposing trade regime:
Reduction in consumer surplus= ___________________
(c) Estimate increase in producer surpluswhen this small country moves from free trade to 20% tariff imposing trade regime:
Increase in producer surplus = ____________________
(d) Estimate "prohibitive" level oftariff:_____________________ %
(e) Estimate total value of "dead weight loss":____________________________
(f) Estimate Government Revenue when 20 % tariff is imposed:______________
(g) Suppose you want to find out a Quantitative Restriction (QR) policy which is equivalent to 20% tariff policy? What should be the quantity volume of import to be licensed to import license holders? Q =__________________
(h) Suppose the government decided to give producers subsidy at 20 % subsidy rate rather than imposing a tariff at 20 %. Estimate the value of "dead-weight loss" from this producer subsidy policy. ______________________________
(i) Suppose the government decided to impose 20 % consumption tax on this imported commodity instead of 20 % tariff policy because it is polluting environment and therefore it is desirable to reduce consumption level. Under this new policy of consumption tax, estimate:
(a) quantity of imports=_________
(b) "dead weight loss" incurring from consumption tax policy:______________
(j) Find the tariff rate (t*) at which tariff revenue is maximized: t* =__________%
Question 3. Suppose the following diagram is copied from Textbook Figure 11.3 Tariffs vs. Production Subsidies to achieve a Production Goal. To let you have a numerical feel, the following numerical example is given which is consistent with Figure 11.3 as follows:
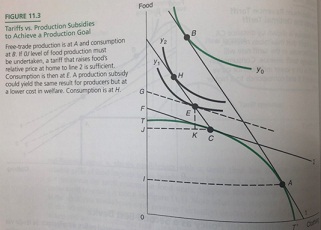
Suppose TCAT' production possibility curve in the above Figure 11.3 is the following function with Y= Food and X = Clothing:
Y = (25 - X^2) ^0.5
Suppose point A is (X=4, Y =3) and point C is (X=3, Y =4). Slope of line 1 = 4/3 and slope of line 2 =3/4. Then line 1 has an equation: Y =25/3 - (4/3) X and line 2 has an equation: Y =6.25 - (3/4) X. Line CH has a slope = 4/3 identical to line 1 (Line AB). Assume also Point B is (X=2.0 Y =5.67), Point H is (X=1.98 Y =5.47), and Point E is (X =2.0 Y =5.33).
(a) Under free trade equilibrium, calculate export quantity of X (clothing) and import quantity of Y (Food).
Export of X = ________ Import of Y =________
(b) After imposing tariff, calculate export quantity of X and import quantity of Y.
Export of X =___________ Import of Y= _______
(c) Instead of tariff, a production subsidy was given to produce Y good at point C which is the same production point after imposing tariff with the relative price line's slope equal to 2. Under production subsidy, what is the export quantity of X and import quantity of Y?
Export of X =________Import of Y=__________
(d) What is tariff rate implicit in the above numerical example?
Tariff Rate _=___________________%
(e) Suppose the following social welfare function is assumed:
y = (X Y)^0.5
(1) Estimate welfare level under free trade equilibrium: y0 =_____________
(2) Estimate welfare level under production subsidy: y2= _______________
(3) Estimate welfare level under tariff imposed: y1= __________________
(4) The following diagram is copied from Figure 11.4 in textbook.The country is exporting good X (clothing) and imports good Y (food)
Suppose the production possibility curve now (TAT') has the following equation as assumed in question 3:
Y = (25 - X^2) ^0.5
Line 1 slope = 3/4 Line 2 slope = 4/3
Point A: X =3 Y = 4
Growth is expressed by enlarged production possibility curves (not drawn).
A' is the initial consumption point corresponding to production along TT' at A.
Growth to any of points B, C, D, and E shows a 25 % in produced income at domestic prices. But corresponding consumption points B', C', D', E' are not equivalent.
(a) What could be levels of production of X and Y under free trade before tariff is imposed at the present time? Choose one from below: ________________
(1) X=4 Y =3 (2) X=3 Y=4 (3) X=5 Y =0 (4) X =0 Y = 5 (5) X=3 Y =3
(b) Which equilibrium point is showing an equilibrium after "immiserizing growth" which can be defined as a biased growth in favor of protecting import-competing industry (Good Y) and which can reduce real income by changing terms of trade? Choose one from below: ________________
(1) D'(2) B' (3) C' (4)A' (5) E'
(c) The above diagram shows as this country imposes tariff on imports of Y -good (Food), what happens to this country's terms of trade? Choose one from below: ______
(1) improves (increases) (2) worsens (reduces) (3) unchanged (4) uncertain
(d) Which dynamic point corresponds to the maximum valuation at world prices and therefore in their real income gain? Choose one from below: ____________
(1) E (2) C (3) B (4) D (5) E'
(e) Which dynamic point corresponds to a fairly balanced expansion? Choose one _______________ from: (1) E (2) C (3B (4) D (5) E'