Reference no: EM131402925
MATLAB Session on Signals, Systems Realization for n-th order system(SIMULINK)
MATLAB Session -
SIMULINK -
- Learn to use "SIMULINK" in MATLAB
- Learn to generate "SIMULINK" models
- Understand "Function Blocks" in SIMULINK
- Generate "Output Trace" using "Scope" and other function blocks in MATLAB SIMLULINK
R-L-C Circuit Example -
- Understand "Physical System", "Schematic System", "Mathematical System"
- Learn to convert "Mathematical System" into "SIMULINK model" and analyze RLC-circuit.
Using SIMULINK in MATLAB -
Creating SIMULINK model files:
INLAB Report (1):
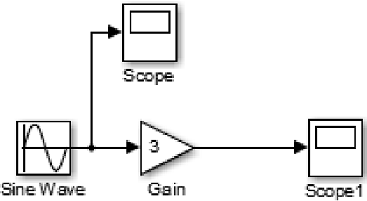
- Create following SIMULINK model and save as file.
- Use a "sine" source block from SIMULINK library to generate -5 to 5 [V] sinusoidal signal.
- Use a "gain" block from SIMULINK library to create the amplitude gain of 3.
- Use two "scope" blocks to display signals - display input and output voltage signal by double clicking "scope" blocks.
- Adjust "scope" y-axis to display between -20 to 20 [V]
R-L-C circuit analysis (Differential Equation) using SIMULINK
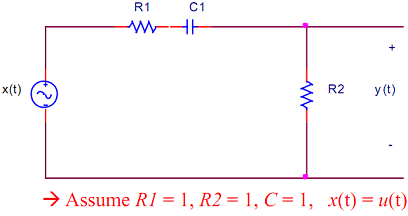
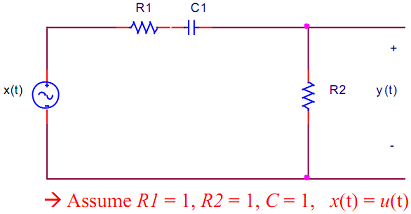
R-L-C circuit example - Find input and output voltage w.r.t. time for below circuit
INLAB Report (1):
- Assume x(t) = u(t) unit step function has been applied to the circuit shown above.
- Find "math model" (differential equation) for the circuit.
INLAB Report (2):
- Create following SIMULINK model for the circuit.
- Use a "integrator" blocks from SIMULINK library to solve for multi-order time derivatives.
dy(t)/dt → ∫→ y(y)
- Apply "unit step" source block from SIMULINK library to the circuit. x(t) = u(t)
- Use two "scope" blocks to display signals - display input and output voltage signal by double clicking "scope" blocks.
- Adjust "scope" y-axis to display between -2 to 2 [V].
R-R-L circuit analysis (Differential Equation) using SIMULINK
R-R-L circuit
- Find input and output voltage w.r.t. time for circuit shown.
INLAB Report (1):
- Assume x(t) = u(t) unit step function has been applied to the circuit shown above.
- Find "math model" (differential equation) for the circuit.
R-R-L circuit
- Find input and output voltage w.r.t. time for circuit shown.
INLAB Report (2):
- Create following SIMULINK model for the circuit.
- Use a "integrator" blocks from SIMULINK library to solve for multi order time derivatives. dy(t)/dt →∫→ y(t)
- Apply "unit step" source block from SIMULINK library to the circuit.
- Use two "scope" blocks to display signals - display input and output voltage signal by double clicking "scope" blocks.
- Adjust "scope" y-axis to display between -2 to 2 [V].
R-R-C circuit analysis (Differential Equation) using SIMULINK
R-R-C circuit
- Find input and output voltage w.r.t. time for circuit shown.
INLAB Report (1):
- Assume x(t) = u(t) unit step function has been applied to the circuit shown above.
- Find "math model" (differential equation) for the circuit.
R-R-C circuit
- Find input and output voltage w.r.t. time for circuit shown.
INLAB Report (2):
- Create following SIMULINK model for the circuit.
- Use a "integrator" blocks from SIMULINK library to solve for multi order time derivatives. dy(t)/dt→ ∫→y(t)
- Apply "unit step" source block from SIMULINK library to the circuit. x(t) = u(t)
- Use two "scope" blocks to display signals - display input and output voltage signal by double clicking "scope" blocks.
- Adjust "scope" y-axis to display between -2 to 2 [V]
1st Order Differential Eq
INLAB Report :
- Generate a time variable from -10 to 10 [sec] in 0.1[sec] step size.
- Use MATLAB function ode23 to plot resulting y(t) with respect to time for 1st order differential equation given below.
- Assume y(0) = 15, use time span from 0 to 10 [sec] for ode23.
- Repeat same problem, but use MATLAB function dsolve to plot resulting y(t) with respect to time for 1st order differential equation given below 10(dy(t)/dt) + y(t) = -20 + 15sin(2t)
INLAB Report:
- Find the solution for the high order differential equation shown below.
- Use MATLAB function dsolve to plot resulting y(t) with respect to time.
- Use initial conditions: y(0) = 0 and y'(0) = 1
d2(y)/dt2 + 8 (dy(t)/dt) + 2y(t) = cos(t)
Attachment:- Assignment File.rar
|
Perform your job responsibilities
: Write a three-page essay on how your own ethics, as well as your work ethics, can directly relate to ethics in advertising as you perform your job responsibilities.
|
|
Explain efficacy of major types of health clinical outcomes
: Evaluate the efficacy of major types of health clinical outcomes one can use in economic evaluation analysis. Provide at least one example to support your response concerning clinical outcomes.
|
|
Determine the effect of pressure and temperature
: Calculate the equilibrium constant and the heat of reaction at 25 °C for this reaction. Is the reaction exothermic, or endothermic?
|
|
Do you observe a trend
: The botanists were interested in the correlation between weight change (y) and digestion efficiency (x). Plot the data for these two variables in a scatterplot. Do you observe a trend?
|
|
Find input and output voltage
: R-L-C circuit example - Find input and output voltage w.r.t. time for below circuit. R-R-L circuit - Find input and output voltage w.r.t. time for circuit shown
|
|
Evaluate the example of presidential leadership
: Describe the example of presidential leadership precisely, including words and deeds. Evaluate the example of presidential leadership.
|
|
Find and interpret the values of r
: Find and interpret the values of r and r2 for the simple linear regression relating the blood lactate concentration and the boxer's perceived recovery.
|
|
Estimate the shear stress
: Estimate the shear stress if the top plate is moving with a velocity ofv= 20±0.2 cm/s. Also find the uncertainty in the estimate.
|
|
What information would be the most important and why
: Consider yourself as a volunteer hired to develop a template for gathering information about major gift prospects. What information would be the most important? Why?
|