Reference no: EM131281958
1. Determine analytically if the functions are even, odd, or neither.
a) f(x) = 4x2 - x + 12
b) f(x) = x3 + x - 15
2. The graph of y = f(x) is given below. Use it and Theorem 1.7 to graph the given transformed function.
a ) y = 4 - f ( 4 - x )
b) y = f ( x + 3 )

3. Sketch the graph of the given piecewise-defined function.
f(x) = 6 - x if x ≤ -3
3x if 0 ≤x < 2
4 if x ≥ 2
4. Find both the point-slope form and the slope-intercept form of the line with the given slope which passes through the given point.
m = 3, P (-7, -1)
m = -2, P ( 10, 4 )
m = ½, P ( -1, 4 )
m = -2/3, P (3, -1 )
5. A sales person is paid $350 per week plus 4% commission on her weekly sales of x dollars.
a) Find a linear function that represents her total weekly pay, W (in dollars) in terms of x.
b) What must her weekly sales be in order for her to earn $500 for the week?
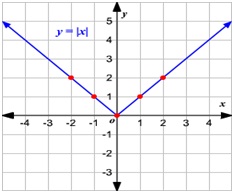
6. Graph each function. Find the x-and y-intercepts of each graph, if any exist. From each graph, determine the domain and range of each function, list the intervals on which the function is increasing, decreasing, or constant.
a) f(x) = | x + 2|
b) f(x) = |3x|
c) f(x) = -2 |x|
7. Find the slope-intercept form of the line which passes through the given points.
a) P ( 2, 7), Q (5, -1)
b) P (3,-5). Q ( 5, -8)
c) P (½, 2/3), Q (5/8, -1/8)
8. Different people were studied to see if there is a relationship between age and cholesterol level. Cholesterol measures the milligrams (mg) of cholesterol per deciliter (dL) of blood. Use the data below to:
a) Draw a scatter plot
b) Find the least squares regression line for these data, add it to your graph and comment on the goodness of fit.
c) Use the regression line to predict the cholesterol level of a 75 year old person.
|
Age (x)
|
35
|
12
|
65
|
47
|
21
|
32
|
52
|
15
|
57
|
|
Cholesterol (y)
|
210
|
160
|
285
|
255
|
180
|
220
|
190
|
170
|
275
|
9. Graph each function.
Find the slope, y-intercept and x-intercept, if any exist.
a) f(x) = 3x + 8
b) f(x) = 5 - x
c) f(x) = (2/3)x - ½