Reference no: EM1327203
Choose a publicly traded company: Home Depot
Part A.
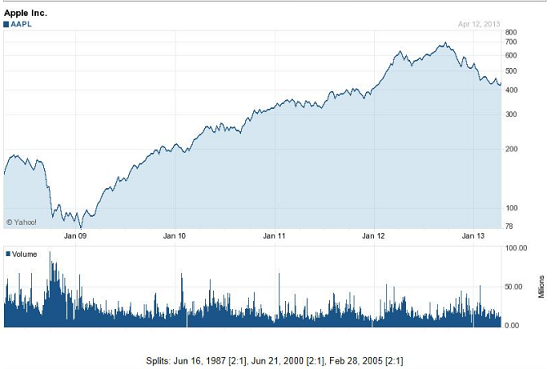
Go to COMPUSTAT Research Insights, Reuter’s, Thomson Financial Service, or Bloomberg Financial (E-Trade Financial Learning Center has them all) or any other financial database such as Yahoo Finance to download the historical closing prices (five years) of your company on the monthly basis (twelve data points a year). Use Microsoft Excel to chart the historical prices (like the one below) based on the monthly data.

Part B.
Based on the financial statements of the latest available annual report, calculate the following financial ratios using only one year data. If the ratios are not available, please explain why. For example, Citibank doesn’t have inventory because it’s a financial company.
(Please use spreadsheet software (MS Excel) for this part and show your calculation)
Current ratio
Quick ratio
Fixed assets turnover
Total assets turnover
Total debt to total assets
Profit margin on sales
Return on total assets
Return on common equity
Price/earnings ratio
Market/book ratio
The final report should include a chart of monthly stock price movements described in part A and the financial ratios in part B above.
Based on the materials provided in the annual report and business news from The Wall Street Journal, as well as the financial information from any other sources, such as Datastream, Reuters, and Bloomberg Financial, explain as much as you can the movement of your stock during the last twelve months. Your report should start with a description of the business and the status of financial condition such as Line of business, Competitive positions, and Profitability History (going back five years). Do not turn in a sloppy, rapidly completed report. All papers should have a title page, a table of contents, a statement of purpose, footnotes or endnotes, or a bibliography or reference. The due date for submitting your project is the last date of the class. You will use Assignment manager to submit your project.
|
Describing the compensatory and punitive damages
: Why is it appropriate that both compensatory and punitive damages exist?
|
|
Explaination of age discrimination
: myths related to age discrimination
|
|
Draw a standard supply and demand diagram
: Draw a standard supply and demand diagram which shows the demand for new housing units that are purchased each month, and the supply of new units built and put on the market each month.
|
|
Violence against women
: How is the traditional use of the concept of patriarchy by feminist researchers on violence against women limited? How do Hunnicutt and Schwartz and DeKeseredy’s challenges to and reconceptualizations of patriarchy reveal the limitations of using the..
|
|
Financial analysis
: Use Microsoft Excel to chart the historical prices (like the one below) based on the monthly data.
|
|
Write a program to compute a
: Write a program to compute A. Test it with P = $55,000 and interest rate of 6.6% (i = 0.066). Compute results for n = 1, 2, 3, 4, and 5 and display the results as a table with headings and columns for n and A
|
|
Develop a well-structured function
: Develop a well-structured function to compute v as a function of t. Then use this function to generate a table of v versus t for t = -5 to 50 at increments of 0.5.
|
|
Compare with the true value
: compare with the true value of 6.737947 x 10 -3 . Use 20 terms to evaluate each series and compute true and approximate relative errors as terms are added.
|
|
Recall the velocity of the falling parachutist
: Question: Recall the velocity of the falling parachutist can be computed by V(t) = gm(1-e -c/mx )/c, Use first order error analysis to estimate the error of v at t=6. If g=9.8 and m=50 but c=12.5 +_ 1.5
|