Reference no: EM132497882
FIN201 Quantitative Applications in Finance Assignment - Kaplan Business School, Australia
Learning Outcomes -
1. Examine the various quantitative techniques used to describe, estimate and evaluate data.
2. Evaluate the strengths and limitations of statistical analysis techniques in finance.
3. Apply quantitative techniques to describe financial data and test claims of performance.
4. Analyse the factors that influence the risk and return of asset classes and financial securities.
5. Assess statistical models used in estimating the value of financial assets and constructing efficient portfolios.
Section A - There are six (6) short-answer questions in this section. Answer all questions.
Questions 1 to 5 -
You have been provided a sample of historical price level of the following shares and index at the end of each month from June 2007 to June 2017 ('Section A Monthly Price&Index' tab) in order to run a number of statistical analysis techniques.
Qantas Airways Limited (QAN)
Telstra Corporation Limited (TLS)
Westpac Banking Corporation (WBC)
Question 1 (Word limit: 200 words) -
(a) Using the historical price level of the QAN, TLS and WBC shares and AORD index available in the tab 'Section A Monthly Price&Index', calculate the monthly rate of returns (%) of these shares and index to two (2) decimal places in the tab 'Section A_Q1'. From your Excel results, paste a copy of the monthly returns for the shares and index for the months of July 2007 and June 2017 only in the answer section of your Word document (and in the format below).
(b) Use Excel's Data Analysis to work out the descriptive statistics for these monthly returns to two (2) decimal places. From your Excel results, paste a copy of the following descriptive statistics in the answer section of your Word document (and in the format below).
(c) Evaluate QAN, TLS, WBC and AORD return series, with reference to sample mean, sample standard deviation, skewness and kurtosis statistics.
Question 2 (Word limit: 200 words) -
(a) Set up a hypothesis test at 5% significance level to determine whether QAN's mean return is significantly different from zero. Show all your workings in the Word document.
(i) What are the null and alternative hypothesis for this test?
(ii) Explain the risks associated with Type I and Type II errors in this context.
(iii) What type of test and distribution would you recommend for this test? Provide reasons for your recommendation.
(iv) Based on your recommendation above, determine the appropriate critical value and test statistic for the hypothesis testing at 5% significance level.
(v) What is your conclusion for this hypothesis test?
(b) Set up the null hypothesis and alternative hypothesis to determine whether TLS's monthly return is significantly different from WBC's monthly return.
(i) What are the null and alternative hypothesis for this test?
(ii) By Using Excel's paired t-Test (see tab Section A_Q2), find the critical value and test statistic for the hypothesis testing at 5% significance level.
(iii) What is your conclusion for this hypothesis test?
Question 3 (Word limit: 500 words) -
An outlier of a sample may affect the accurate statistical analysis. If an observation is away from its sample mean by more than 3 standard deviations, it can be considered as an outlier.
(a) Standardise the monthly returns using the formula [(x-x-)/s] to two (2) decimal places using tab 'Section A_Q3'. From your Excel results, paste a copy of the standardised returns for the shares and index for the months of July 2007 and June 2017 only in the answer section of your Word document (and in the format below).
(b) Identify all the standardised monthly returns which are either greater than 3 or smaller than -3 (i.e. more than 3 standard deviations away from zero). Report the stock, month, actual value and standardised value.
(c) You decide to replace the outlier with the mean observation calculated for Question 1 in 'Section A' instead. Explain how this is likely to affect the mean return, standard deviation, skewness, and kurtosis of the monthly returns (note: no calculations are required).
(d) What are two alternative adjustments you could make to the data in order to avoid having the outlier skew the results.
Question 4 (Word limit: 600 words) -
Run a regression analysis for WBC stock against the AORD Index using the monthly rate of returns data from July 2007 to June 2017 inclusively (see tab Section A_Q4).
Hint: Use the 'Regression' function in the 'Data Analysis' add-in. Select 'Residuals' and 'Residual plots' from the regression window.
(a) Provide the estimated regression equation for WBC, with coefficients to four (4) decimal places.
(b) Predict the WBC returns when the monthly return on the AORD is 7.5%, as a % to two (2) decimal places.
(c) At 0.05 level of significance, is there evidence of a linear relationship between WBC and AORD? Show all your workings in relation to your conclusion.
(d) What is the R-square statistic and interpret its meaning for this regression?
(e) Generate the residual plot (scatter plot of residuals of the above regression against AORD) for the above regression. Paste your residual plot from excel file to word document. Comment on heteroskedasticity of this regression with reference to the residual plot.
(f) Discuss the ways of eliminating heteroskedasticity issues. Your discussion requires three (3) points.
(g) Calculate the Durbin-Watson statistic for the above regression, and provide this in the Word document of your assignment, to four (4) decimal places. Comment on the serial correlation of this regression with reference to Durbin-Watson statistic.
(h) Discuss the ways of eliminating serial correlation issues. Your discussion requires three (3) points.
Question 5 (Word limit: 300 words) -
(a) Discuss the use of autoregressive (AR) models in finance.
(b) Run an AR1 model for TLS stock using the monthly rate of returns data from August 2007 to June 2017 inclusively (see tab Section A_Q5).
AR(1) model for TLS stock: TLSt = b0 + b1TLSt-1 + εt
Hint: Use the 'Regression' function in the 'Data Analysis' add-in.
(i) Provide the estimated AR(1) equation for AR(1) model for TLS stock, with coefficients to four (4) decimal places.
(ii) What are the implications for estimation and inference if the errors of the AR(1) model estimated in (i) are also serially correlated?
(iii) Discuss why is it not appropriate to test for autocorrelation in an AR model using the Durbin-Watson test.
Question 6 (Word limit: 300 words) -
An equally weighted three-stock portfolio consist of shareholdings in Qantas Airways Limited (QAN), Telstra Corporation Limited (TLS) and Westpac Banking Corporation (WBC).
Calculate the portfolio returns (in the column named 'ri') using the monthly returns data from July 2007 to June 2017 (to two (2) decimal places) in the tab 'Section A_Q6'.
Consider the CAPM regression model given below: ri - rf = αi + βi(rm - rf) + εi
Run a regression analysis for above CAPM model using the portfolio monthly rate of returns data from July 2007 to June 2017 inclusively. Use 3.0% p.a. as the risk-free return (rf) and AORD monthly returns as market returns (rm).
Hint: Use the 'Regression' function in the 'Data Analysis' add-in.
(a) Provide the estimated CAPM regression equation, with coefficients to four (4) decimal places.
(b) What is the beta (β) value of the portfolio?
(c) Comment on the portfolio beta value in comparison to the slope coefficient of the regression equation for WBC (WBC stock's beta value) which you have obtained in Question 4.
(d) Discuss the limitations of CAPM.
Section B - There are two (2) short-answer questions in this section. Answer all questions.
Question 7 (Word limit: 300 words) -
You have been provided a sample of historical monthly returns of the following shares and index at the end of each month from July 2007 to June 2017 ('Section B_Q7_Monthly Returns' tab) in order to run a number of statistical analysis techniques.
AGL Energy Limited (AGL)
Commonwealth Bank of Australia (CBA)
Graincorp Limited (GNC)
Melbourne IT Limited (MLB)
(a) Using the monthly returns from July 2007 to June 2017, calculate the variance-covariance matrix of AGL, CBA, GNC and MLB to five (5) decimal places on the' Section B_Q7' tab.
From your Excel results, paste a copy of the covariance matrix in the answer section of your Word document (and in the format below).
(b) Suppose you have a portfolio with an equal amount into these four shares (i.e. the portfolio consists of ¼ of AGL, ¼ of CBA, ¼ of GNC and ¼ of MLB). Using Excel or otherwise, calculate the variance of this portfolio, to five (5) decimal places and report it on the word file.
(c) You expect the long-term monthly returns of the stocks to be as follows:
|
AGL
|
0.54%
|
|
CBA
|
0.55%
|
|
GNC
|
0.27%
|
|
MLB
|
0.60%
|
Use the variance/covariance matrix you have calculated for part a) and find the expected optimal allocation (portfolio weight) to each share in the portfolio (weights must all be greater than zero and add up to 100%) with least expected variance but with an expected return of at least 0.55% per month. Provide the weights (%) of the optimised portfolio and its expected variance to five (5) decimal places).
Question 8 (Word limit: 600 words) -
Note: Use Figure 1 to answer part (a) of this question below.
Figure 1 -
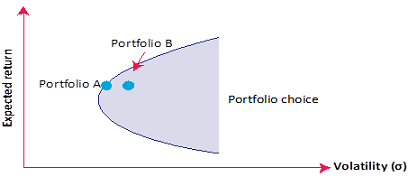
(a) (i) What does Figure 1 depict and what is the financial name or description given to the diagram?
(ii) Which portfolio (A or B) would be preferred and why?
Section B_Q8' tab of the excel workbook gives three portfolio returns (Portfolio_A, Portfolio_B and Portfolio_C). The risk-free rate is given as 3.00% p.a.
(b) Based on the monthly returns data from July 2007 to June 2017 and assuming the risk-free rate is 3.0% p.a., calculate the Sharpe ratios for each of the three portfolios (A, B, and C), as a % rounded to two (2) decimal places. Compare the three portfolios based on their Sharpe ratios.
(c) Discuss the advantages and disadvantages of Sharpe ratio for measuring portfolio performance.
(d) What is tracking error?
(e) Based on the given monthly returns date from July 2007 to June 2017 and using AORD returns (from Section A of the assignment) as the benchmark calculate the annualised tracking error (%) of Portfolio_A, Portfolio_B and Portfolio_C, to two (2) decimal place. Compare three portfolios based on the tracking error.
Note: Use standard deviation method.
(f) Based on the given monthly returns date from July 2007 to June 2017 and using AORD returns as the benchmark calculate the information ratio (%) of Portfolio_A, Portfolio_B and Portfolio_C, to two (2) decimal place. Compare three portfolios based on the information ratio.
(g) Discuss the advantages and disadvantages of information ratio for measuring portfolio performance.
Attachment:- Quantitative Applications in Finance Assignment Files.rar