Reference no: EM131706
Problem 1
1. Using IF, filter the data for these students into a column which contains the heights of only female students and a column which contains only the heights of male students.
Here is a portion of the result:
only female students, and a column, which contains only the heights of male students.
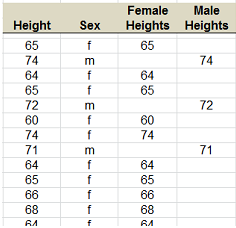
Here is a portion of the result:
2. Create a named range called "FemaleHeights" for the female height data and a named range called "MaleHeights" for the male height data.
3. In columns D and E, (below row 70) enter formulas which calculate the appropriate statistics for the female height data and the male height data using the named ranges.
3. In columns D and E, (below row 70) enter formulas which calculate the appropriate
4. Use conditional formatting to shade the tallest female and male students.
5. Format the area containing the statistics to look as follows:
Female Male
Number of samples = 36.00 25.00
Average = 65.00 71.32
Standard Deviation = 3.19 2.17
Problem 2
In the sheet "Problem 2", you are given information about a loan. Use this information to create a loan calculator. Notice that some cells have been given names. Use these names in formulas where appropriate. You can view all named cells in the Name Manager under the Formulas tab.
1. In cell H6, use the PMT formula to calculate the payment due each month. Name this cell "Sched_Payment".
2. In cell H7, calculate the scheduled number of payments. (Loan Period in Years * Number of Payments Per Year)
3. Use formulas to fill in the columns as shown below. Lookup the DATE formula to figure out how to fill in the Payment Date column. Use IF statements where appropriate (for instance, to adjust Scheduled Payment if the Balance falls below "Sched_Payment")
4. In cell H8, use COUNTIF to calculate the actual number of payments. This may be less than the scheduled number of payments if there have been extra payments.
5. In cells H9 and H10, calculate Total Extra Payments and Total Interest.
Problem 3
In the sheet "Problem 3" you are to create various investment portfolio appreciation scenarios. The portfolio has an initial balance (cell C1) of $20,000.
1. Create a column of years from 2013 through 2023 using a formula so that when the first year is changed, the ensuing years change, too. For example, if the first year is changed to 2015, then the range should automatically change from 2015 through 2025.
2. Create columns for 5 different portfolio growth rates: 2%, 4%, 6%, 7% and 8%.
3. At the end of each year, the portfolio grows by that amount. Provide the calculations necessary. Make sure that your formulas use proper anchoring ($) to allow the formulas to be copied. You should be able to copy the formula down and across without changing the formula.
4. Calculate the total portfolio appreciation (how much it has increased) for the time period.
5. Format the model exactly as shown.
6. Test your model with different initial balances, growth rates, and initial year.