Reference no: EM13835482
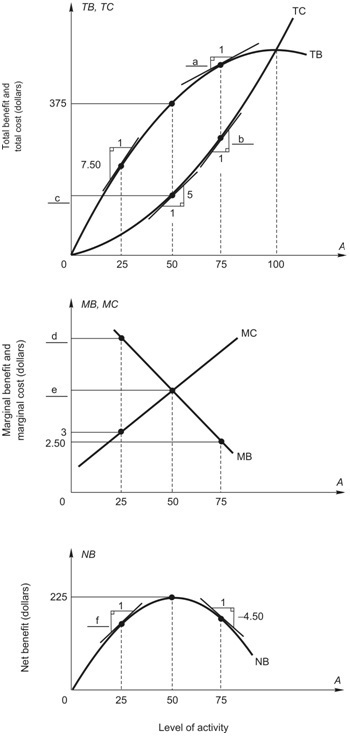
1. Use the figure below to fill in the blanks in the following questions.

a. The values that belong in the blanks a - f in the figure on the previous page are:
|
a.
|
______
|
d.
|
______
|
|
b.
|
______
|
e.
|
______
|
|
c.
|
______
|
f.
|
______
|
b. The optimal level of activity is ______ units of activity where ______ (TB, TC, MB, MC, NB) reaches its maximum value of $_________.
c. Because TB is maximized at 100 units of activity, a line drawn tangent to the TB curve at 100 units of activity (not shown in the figure) has a slope of ______. NB at 100 units of activity is $_________, which is identical to the value of NB at ______ units of activity. Beyond 100 units, NB is _____________ (positive, rising, zero, negative).
d. At 25 units of activity, ______ (TB, TC, MB, MC, NB) is rising faster than ______ (TB, TC, MB, MC, NB) is rising, and thus ______ (TB, TC, MB, MC, NB) is rising.
e. At 75 units of activity, decreasing the activity causes ______ (TB, TC, MB, MC, NB) to fall faster than ______ (TB, TC, MB, MC, NB) falls, and thus ______ (TB, TC, MB, MC, NB) rises.