Reference no: EM131404910
Refer to given Exercise about the trend in number of persons per household.
a. Using statistical software, determine the least squares line for these data. Use the equation of this line to estimate the number of persons per household in the year 2010 (Data source: perhouse dataset on the website for this book).
b. What is the slope of the line? Interpret the slope in the context of these variables.
c. Based on the regression line, what would be the predicted persons per household in the year 2200? Realistically, what is the lowest possible value of the persons per household number? How does the estimate for 2200 compare to this value?
d. Part (c) illustrates that the observed pattern can't possibly continue in the same manner forever. Sketch the pattern for the trend in persons per household that you think might occur between now and the year 2200.
Exercise
U.S. Census Bureau estimates of the average number of persons per household in the United States for census years between 1850 and 2000 are shown in the following table. (These data are in the file perhouse on the companion website.)
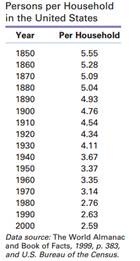
a. Draw a scatterplot for the relationship between persons per household and year. Is the relationship linear or curvilinear? Is the association between persons per household and year positive or negative?
b. On your scatterplot, add a line that you believe fits the data pattern. Extend this line to the year 2010. On the basis of this line, estimate the number of persons per household in the United States in the year 2010.
|
Create a copy of a professional cv/resume
: Read "Professional Portfolio: A Snapshot of Your Career" by Sherrod, from the Nursing Center (2007). Use the information from the Sherrod article to create a copy of a professional CV/resume using the following guidelines:1) The résumé should not..
|
|
How can corporate governance mechanisms create conditions
: How can corporate governance mechanisms create conditions that allow top executives to develop a competitive advantage and focus on long-term performance?
|
|
Research culture with particular focus on business culture
: Prior to sending your team to Saudi Arabia there are some aspects of the culture that everyone needs to know about. Research the culture with particular focus on the business culture.
|
|
Discuss about the social attitudes and behaviors
: Examine the difference between, and the gap separating, people's environmental and social attitudes and behaviors (the so-called A-B split)
|
|
Extend given line to the year 2010
: On your scatterplot, add a line that you believe fits the data pattern. Extend this line to the year 2010. On the basis of this line, estimate the number of persons per household in the United States in the year 2010.
|
|
Discuss about the health care and human capital
: Explore whether or not funding from international lending institutions like the World Bank and the IMF are helping or hindering the social, economic, or political development of the country that you have selected. Support your response with examp..
|
|
Make a presentation on your team effectiveness report
: Your boss wants you to make a presentation on your team effectiveness report (completed in Week 3) to the management team including your chief executive officer.
|
|
List and analyze the population demographics
: List and describe the population demographics. Be sure to cover gender, race, national origin, age, disability, and religion. Create a table to present this information.
|
|
Relationship between persons per household and year
: Draw a scatterplot for the relationship between persons per household and year. Is the relationship linear or curvilinear? Is the association between persons per household and year positive or negative?
|