Reference no: EM133501322
Assignment specification
Exercise 1
Consider the network depicted in Figure 1. Assume that each link in this network has an unavailability 0.1%. Calculate the end-to-end availability of the connections from C to J, H or F, as well as, I to J, H or F (a total of six traffic streams as shown in Figure 1). Do this calculation manually by the perfect middle method, and also use the Netml availability tool. Use colour, opacity, and width, as well as labels, to visualize the unavailability values for the traffic streams. Present both answers and compare the results numerically. Also, explain why some traffic streams have higher unavailability than others.
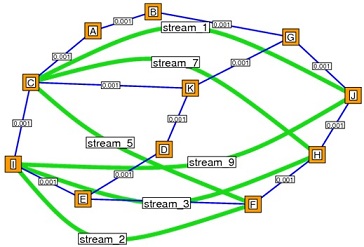
Figure 1. An unreliable network
Exercise 2
Suppose the target unavailability of each of the six traffic streams in Figure 1 is 0.0004% (i.e. 0.000004). Is it possible to achieve this, in the network shown in Figure 1 by no more changes that adding one link? If so, explain which link to add and explain why this design will achieve the desired standard of unavailability. Is it possible to achieve this improved design, which meets the standard of 0.0004% unavailability, end-to-end, in more than one way? If so, specify all the ways to achieve the desired standard.
Exercise 3
Use the ping command with a variety of packet sizes (e.g., 100 bytes up to 1500 bytes in increments of about 100 bytes. No need to add any other extra data size, e.g., size of the header) to display the effect of packet length on the transmission delay. Ping the nearest Internet node which responds to a ping packet and the number of pings in each ping experiment is set to 20. The IP address of this node can be found by using a traceroute/tracert command.
Plot your results, with a line of best-fit, and estimate:
1. the propagation delay between the end-points of your pings;
2. the transmission speed (in bits/sec) of the link between the end-points of your pings.
Criteria
1. In Exercise 1, the end-to-end unavailability of all six traffic streams has been correctly calculated manually, with an explanation of the calculation.
2. The end-to-end unavailability of all six traffic streams has been calculated by the Netml system and presented as a diagram showing the unavailability clearly in labels of traffic streams and also by means of visual characteristics.
3. The results of the two calculations have been compared and the differences between the two approaches have been discussed.
4. In Exercise 2, an answer to the question as to whether the network can be designed to achieve the prescribed target unavailability has been given, and justified.
5. A revised network design has been shown and analysed, showing the unavailabilities clearly.
6. The revised network design meets the planned unavailability standard.
7. In Exercise 3, the ping experiment has been carried out.
8. The results obtained in this way have been processed and plotted.
9. A linear fit to the plotted results has been included with the plot of the data points.
10. The linear fit has been used to infer the propagation delay and effective transmission speed.