Reference no: EM131399186
Refer to the five-number summaries given in Exercise 1.
a. Using the appropriate summary value, compare the location of the fastest ever driven response for males to the location for females.
b. Explain whether the spread is greater for one sex than the other or whether it is about the same.
Exercise 1
This is the same as Exercise 2. The five-number summaries of the fastest ever driven data given in Case Study 1.1 (page 2) were as follows:
|
|
Males (87 Students)
|
Female (102 Students)
|
|
Median
|
110
|
89
|
|
Quartiles
|
95
|
120
|
80
|
95
|
|
Extremes
|
55
|
150
|
30
|
130
|
Give a numerical value for each of the following:
a. The fastest speed driven by anyone in the class.
b. The slowest of the "fastest speeds" driven by a male.
c. The speed for which one-fourth of the women had driven at that speed or faster.
d. The proportion of females who had driven 89 mph or faster.
e. The number of females who had driven 89 mph or faster.
Exercise 2
Refer to the data and five-number summaries given in Case Study 1. Give a numerical value for each of the following.
a. The fastest speed driven by anyone in the class.
b. The slowest of the "fastest speeds" driven by a male.
c. The speed for which one-fourth of the women had driven at that speed or faster.
d. The proportion of females who had driven 89 mph or faster.
e. The number of females who had driven 89 mph or faster.
Case Study 1
Who Are Those Speedy Drivers?
A survey taken in a large statistics class at Penn State University contained the question "What's the fastest you have ever driven a car? mph." The data provided by the 87 males and 102 females who responded are listed here.
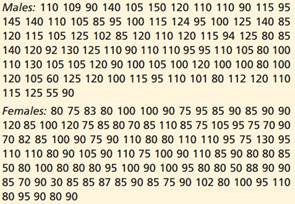
From these numbers, can you tell which sex tends to have driven faster and by how much? Notice how difficult it is to make sense of the data when you are simply presented with a list. Even if the numbers had been presented in numerical order, it would be difficult to compare the two groups.
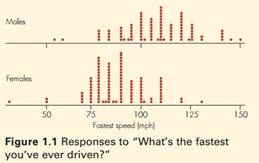
Your first lesson in statistics is how to formulate a simple summary of a long list of numbers. The dotplot shown in Figure 1.1 helps us see the pattern in the data. In the plot, each dot represents the response of an individual student. We can see that the men tend to claim a higher "fastest ever driven" speed than do the women.
The graph shows us a lot, and calculating some statistics that summarize the data will provide additional insight. There are a variety of ways to do so, but for this example, we examine a five-number summary of the data for males and females. The five numbers are the lowest value; the cut-off points for one-fourth, one half, and three-fourths of the data; and the highest value. The three middle values of the summary (the cutoff points for one-fourth, one-half, and three fourths of the data) are called the lower quartile, median, and upper quartile, respectively. Five-number summaries can be represented like this:
|
|
Males (87 Students)
|
Female (102 Students)
|
|
Median
|
110
|
89
|
|
Quartiles
|
95
|
120
|
80
|
95
|
|
Extremes
|
55
|
150
|
30
|
130
|
Some interesting facts become immediately obvious from these summaries. By looking at the medians, you see that half of the men have driven 110 miles per hour or more, whereas the halfway point for the women is only 89 miles per hour. In fact, three-fourths of the men have driven 95 miles per hour or more, but only one fourth of the women have done so. These facts were not at all obvious from the original lists of numbers.
Moral of the Story: Simple summaries of data can tell an interesting story and are easier to digest than long lists.
Definitions: Data is a plural word referring to numbers or nonnumerical labels (such as male/female) collected from a set of entities (people, cities, and so on). The median of a numerical list of data is the value in the middle when the numbers are put in order. For an even number of entities, the median is the average of the middle two values. The lower quartile and upper quartile are (roughly) the medians of the lower and upper halves of the data.
|
Four components of gdp
: Explain which of the four (4) components of GDP had, or is having, the greatest positive impact in our economy. Use the following historical tables to support your response. (Note: The US economy has been growing steadily since 2010.)
|
|
Text book is strategic staffing
: Text book is Strategic Staffing third edition by Phillips & Gully, chapter 12 final exam. The name of the class is BHR 4601, Staffing organizations, Columbia Southern University. What might prevent organizations from evaluating their staffing systems..
|
|
Give numerical value for fastest speed driven by anyone
: Give a numerical value for the fastest speed driven by anyone in the class.- The slowest of the "fastest speeds" driven by a male.
|
|
International treaties
: In considering the international realm, let's consider the concept of economic treaties. Specifically, let's think about an organization like the European Union (EU).
|
|
Explain whether the spread is greater
: Using the appropriate summary value, compare the location of the fastest ever driven response for males to the location for females. - Explain whether the spread is greater for one sex than the other or whether it is about the same.
|
|
Communication improves employee trust and engagement
: Explain the ways that effective communication improves employee trust and engagement. Focus on comparing/contrasting two types of channels or techniques (e.g., on-site meetings, employee surveys, workshops).
|
|
How a plc could be used for control the operation
: Using the equipment provided you are to demonstrate how a PLC could be used for control the operation for an elevator. The elevator has a button on each floor to call the elevator to that floor.
|
|
Bureau of printing and engraving to print
: Why the Federal government doesn't order the Bureau of Printing and Engraving to print enough extra currency to cover all of these property losses due to natural disasters and give it to the storm victims so they can get things back to the way ..
|
|
Find money you would need to pay for additional resources
: If you started a business that made surfboards, what factors of production would you need to make your product? Where would you get them? Where would you find the money you would need to pay for additional resources?
|