Reference no: EM133284866
Battery and Electrical Systems
Part 1
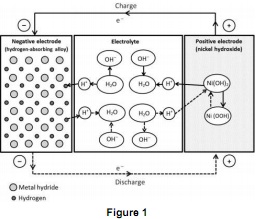
Question 1. Figure 1 shows the schematics of a nickel-metal hydride battery. Based on this figure, explain the potential reaction mechanism with detailed processes at during both charge and discharge?
Question 2. Figure 2 is the Electrochemical Impedance Spectroscopy (EIS) curves of lithium ion batteries with Si/Graphite anode (•) and Graphene-coated Si/Graphite (Si/Graphite @ Graphene) anode (•). The inset is a representative equivalent circuit for the lithium ion batteries.
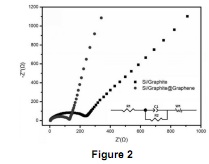
(i) Explain the meaning of Electrical Impedance and R1, C1, R2, W1 in the equivalent circuit.
(ii) Compare the EIS curves of Si/Graphite and Si/Graphite @ Graphene in Figure 3 and discuss the function of graphene coating in this battery system.
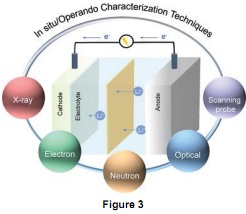
Question 3. Figure 3 shows commonly used in situ/operando characterization techniques in battery study. Choose one specific characterisation technique and explain its functions and applications in battery diagnose.
Part 2
Question 1. Figure 1 is a schematic of the comparison of intercalation-type anode materials, alloying-type anode materials, and conversion-type anode materials.
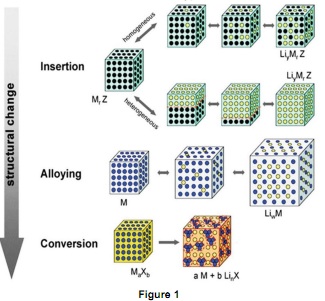
(i) List one representative anode material for each type of reaction and write down their chemical reactions.
(ii) Explain briefly the advantages and limitations of alloying-type and conversion-type anode materials.
(iii) List at least two strategies for improvement of ionic conductivity of conversion-type anode materials and explain the reason.
Question 2. A layered intercalation compound Na0.7MnO2 was prepared through pre-intercalating Na ions into pure MnO2 interlayers. The electrodes with 1 mg as-prepared Na0.7MnO2 and with 1 mg original pure MnO2 were assembled into supercapacitors, separately. Na2SO4 was used as the electrolyte.
Figure 2(A) shows the charge-discharge curves of Na0.7MnO2 (dashed line) and MnO2 (solid line) at the current of 1 mA. Figure 2(B) shows the cyclic voltammograms of Na0.7MnO2 (dashed line) and MnO2 (solid line) at 1 mV/s. Figure 2(C) shows the schematic for the diffusion behaviours of layered active materials with or without pre- intercalation of electrolytic cations into the layers (left: pure MnO2, right: Na0.7MnO2).
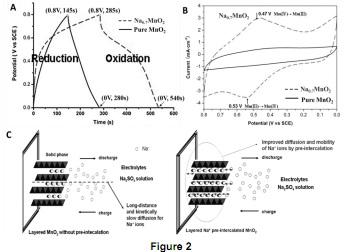
(i) The cutoff voltage and time have shown in the charge-discharge curves in Figure 2(A). Calculate the discharge specific capacity (unit: F/g) and half cell (3-electrode) specific energy density (unit: Wh/kg) of the Na0.7MnO2 supercapacitor and MnO2 supercapacitor, separately.;
(ii) According to the cyclic voltammograms in Figure 2(B), explain why the capacity of Na0.7MnO2 is larger than the capacity of MnO2.
(iii) According to the schematic for the diffusion behaviors of pure MnO2 and Na0.7MnO2 in Figure 2(C), discuss briefly pre-intercalation effects in supercapacitors.
Part 3:
Question 1. Figure 1 is a schematic of the different types of sodium-sulfur battery.
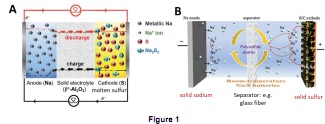
(i) Explain the type(s) of sodium-sulfur battery in Figure 1(A) and operating temperature(s) and reaction mechanism.
(ii) Explain the type(s) of sodium-sulfur battery in Figure 1(B) and their advantages and limitations.
Question 2. Explain what is thin-film solid-state battery, what are the advantages and limitation and how to overcome the limitation?
Question 3. Briefly describe how to prepare a transparent microbattery? Include in the discussion each of the following: choices of substrate and material, preparation strategies.