Reference no: EM132362622
Microeconomics Assignment
Question 1
Explain the meaning of market equilibrium for the market for rental accommodation show your answer with a diagram.
If the government decided to impose rent control in Australia’s capital cities as a way to prevent rising rents what might happen. Use a supply and demand diagram to show the effects of this action. What would landlords do as a response? Is rent control a valid solution?
Question 2
Explain the impact of the following events on the peanut industry
(Use Supply and demand diagram in your answer):
a) The price of fertilizer used in growing peanuts rises
b) Consumers’ tastes change so that they now prefer popcorn to peanuts
c) A drought reduces the productivity of land used to produce peanuts
d) Doctors find that peanuts are bad for the overall general health
Question 3
Suppose the price elasticity of demand for railway travel is elastic. If the rail authority wants to raise revenue from fares, should it raise them or lower them? You might illustrate your answer with a diagram
Question 4
Using diagrams in your answer what are the possible circumstances under which the burden of an excise tax would be borne
i) entirely by consumers
ii) entirely by producers.
Question 5
How do the diminishing marginal returns to scale differ from diseconomies of scale?
What is the difference between a firm’s explicit costs and implicit costs?
Question 6
What is the difference between the price elasticity of demand and the income elasticity of demand? What does the cross elasticity of demand measure? Why should a firm or business know the difference between each of the three concepts?
Question 7
(a) Illustrate and explain using diagrams how a single seller within the market causes an inefficient allocation ofresources and why that is bad;
(a) What market structure isused to benchmark allocative efficiency and why dowe use it? Illustrate and explain using a diagram
Question 8
Illustrate and explain using diagrams, two (2) market mechanisms that can be used for controlling pollution as a negative externality.
Question 9
The following diagram shows the cost curves of a firm under perfect competition.
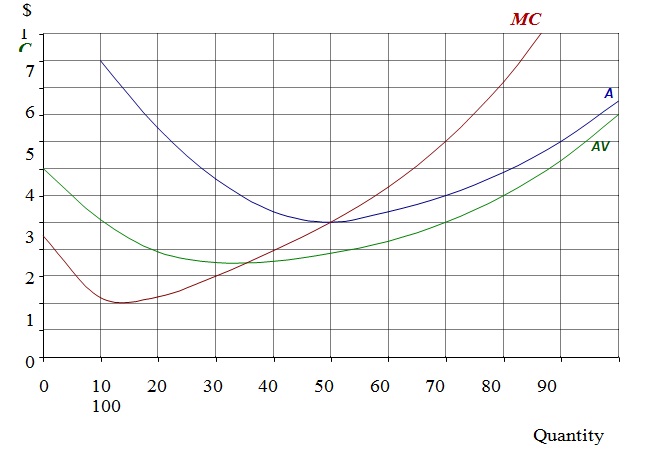
(a) How much will the firm produce in order to maximise profit sata price of $8perunit?
(b) What will be its average cost of production at this output?
(c) How much (supernormal) profit will it make?
(d) How much will the firm produce in order to maximise profit sata price of $5perunit?
(e) How much (supernormal) profit will it make?
(f) How much will the firm produce in order to maximise profit sata price of $4perunit?
(g) What will be its profit value be now?
(h) Below what price would the firm shutdown in the short run?
(i) Below what price would the firm shut down in the long run?