Explain the difference between classification and prediction

Assignment Help Applied Statistics
Reference no: EM132317933

Business Analytics Assignment -

Q1. Carefully Read the "CommBank Retail Business Insights Report FY18" provided with this as an attachment and answer the below questions.

i. Comment on the insights report based on the overall features; including the quality of visualisations, presentability, and the information provided.

ii. List the key information you derive from this insights report and explain how they will be useful in decision making.

iii. Write an abstract (one paragraph) summarising the insights report.

iv. Suggest improvements to this insights report.

Q2. Regression analysis is a commonly used technique to find relationships among variables. Answer the below questions based on regression analysis.

i. Provide an example where regression analysis can be effectively used.

ii. Collect height and weight data from 10 friends/relatives of yours and complete the below table. Every student in class should have a unique set of values.


Height

Weight

1


2


3


4


5


6


7


8


9


10


iii. Draw a scatterplot based on above data. Based on your plot comment on the relationship between height and weight.

iv. Compute the equation of the regression line.

v. Calculate the R2 value and comment on the goodness of the fit.

vi. Use an analytics tool of your choice to calculate the values for iv, and v. Compare them with your answer.

Q3 Classification and regression are commonly used processes in business analytics.

i. Briefly explain the difference between classification and prediction.

ii. Give examples for classification methods you know.

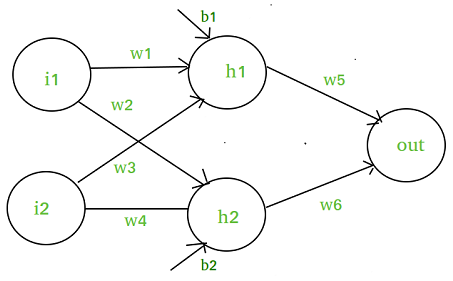
iii. The following diagram shows a neural network with one hidden layer.
1468_figure.png

Write down the algebraic equation for y1 in terms of input values i1, i2 and weights w. Briefly explain how neural networks are used for classification.

iv. Give at least three examples how clustering can be used in business analytics. In your answer explain how each business case could be addressed using clustering.

Attachment:- Assignment Files.rar

Reference no: EM132317933

Questions Cloud

Tangent to an indifference curve : The optimal purchasing rule is satisfied when a budget line is tangent to an indifference curve. Explain with economic reasoning and an appropriate diagram.
Goals and mission of the organization : Employee loyalty is to the goals and mission of the organization and that same loyalty requires that all perceived unproductive behaviour by management
Provide a summary and a reaction to the article : Find a journal article online about a company that recently added or dropped a product or service, or a company that decided to outsource. In the subject line
Entering international markets : Your pharmaceutical firm is seeking to open up new international markets by partnering with various local distributors. The different distributors
Explain the difference between classification and prediction : Victorian Institute of Technology - MITS6002 Business Analytics Assignment. Explain the difference between classification and prediction
Weak contributors to the group purpose : The cluster dynamic is affected once bound people are seen as weak contributors to the group purpose.
Rational for floyd to enroll in the course : The current interest rate is 10%. Is it economically rational for Floyd to enroll in the course? Show your work.
Exchange rate effects on your firm : Describe how a change in the exchange rate affected your firm. Explain what happened to your price and quantity. How can you profit from future
Compensating wage differentials : Explain in 4-5 sentences how the "winner's curse" applies to compensating wage differentials.

Reviews

len2317933

6/7/2019 12:28:18 AM

Business Analytics - a assignment on business analytics, just based on that question I need an answers, but make sure should be better for the given questions. The first question write an answer based on insight report regarding com bank.

Write a Review

Applied Statistics Questions & Answers

  Hypothesis testing

What assumptions about the number of pedestrians passing the location in an hour are necessary for your hypothesis test to be valid?

  Calculate the maximum reduction in the standard deviation

Calculate the maximum reduction in the standard deviation

  Calculate the expected value, variance, and standard deviati

Calculate the expected value, variance, and standard deviation of the total income

  Determine the impact of social media use on student learning

Research paper examines determine the impact of social media use on student learning.

  Unemployment survey

Find a statistics study on Unemployment and explain the five-step process of the study.

  Statistical studies

Locate the original poll, summarize the poling procedure (background on how information was gathered), the sample surveyed.

  Evaluate the expected value of the total number of sales

Evaluate the expected value of the total number of sales

  Statistic project

Identify sample, population, sampling frame (if applicable), and response rate (if applicable). Describe sampling technique (if applicable) or experimental design

  Simple data analysis and comparison

Write a report on simple data analysis and comparison.

  Analyze the processed data in statistical survey

Analyze the processed data in Statistical survey.

  What is the probability

Find the probability of given case.

  Frequency distribution

Accepting Manipulation or Manipulating

Free Assignment Quote

Assured A++ Grade

Get guaranteed satisfaction & time on delivery in every assignment order you paid with us! We ensure premium quality solution document along with free turntin report!

All rights reserved! Copyrights ©2019-2020 ExpertsMind IT Educational Pvt Ltd