Reference no: EM131417227
Question -1:
1. Planet Earth is our only home for the time being. As global populations grow and our resources dwindle, we should worry more about the issues of
a. Scarcity and Choice.
i. List the 5 most critical nonrenewable resources,
ii. (do not use the following:
1. oil of any kind,
2. any kind of fossil fuel including coal, or natural gas, shale oil,
3. timber,
4. or Uranium) please don't use nuclear power (it's the output of a production process)
iii. Do some research on critical nonrenewable resources and make your list. Check out the 17 rare earth elements, or some of the items in the periodic table.
iv. For each of the 5, explain why it is critical to human survival on the planet,
1. Discuss why those nonrenewable resources are so critical to us. What's it used for and why are those things so critical? You need to be thorough.
v. For each of the 5, discuss 3 things we need to do today relative to that nonrenewable resource, to avoid running out of that resource.
1. Discuss the implications of your choices, both positive and negative. Make sure you have 3 suggestions for EACH of your 5 resources.
b. The theory of rational behavior says that we humans act in our own self-interest. Given our actual behavior and the decisions we have and are continuing to make relative to the planet, please:
i. Explain how over-pumping aquifers around the world is in our best interest.
1. Define over-pumping of aquifers.
2. Explain how the continued over-pumping of aquifers in America, China, and India, could impact our ability to survive on the planet. Hint - what do America, China, and India have in common relative to water?
3. Discuss 3 things we can do to stop the over- pumping problem. Focus on the top uses of water in the world. Hint - personal use is not one of them. Need some detail here.
c. Utility Concepts:
i. Explain the 4 concepts of Utility, Total Utility, Marginal Utility, and Diminishing Marginal Utility.
ii. Explain how those 4 concepts relate to a yes or no decision to implement the Keystone XL Pipeline project.
1. You should be able to explain each of these concepts as they relate to rational behavior.
2. You should be able to discuss the implications of our not always behaving rationally.
3. You should discuss each concept as it relates to the Keystone decision.
d. The Theory of Consumer Behavior:
i. Explain each of the key elements of the Theory of Consumer Behavior and what the theory tells us.
ii. Explain how well the theory of consumer behavior reflects reality.
e. Marginal analysis is a decision-making tool.
i. Please define Marginal Cost and Marginal Benefit, and how one would decide to increase or decrease an activity based on the MC - MB assessment.
1. You can get this from the notes.
ii. Explain 3 examples of MC and 3 examples of MB related to the Keystone XL Pipeline question.
Question 2. The Production Possibilities Model is one of the first Economic Models students learn about.
a. Please explain what the mode teaches us.
b. Please explain each of the 4 assumptions of the model.
c. Please explain Productive Efficiency and how it relates to the ppc.
i. Define it and explain how it relates to the ppc.
d. Please explain Allocative Efficiency and how the point of AE is found.
i. Define it,
ii. Discuss the significance of allocative efficiency relative to the model
iii. Explain the 2 step process for finding the point of allocative efficiency on the PPC.
e. On the topic of Economic growth: need to see some detail here.
i. What does it mean?
ii. How can it be graphically represented?
iii. What are the prerequisites to Economic growth?
iv. Why is Economic growth important?
v. What factors tend to limit growth and how?
f. The Presentville - Futureville case:
1. Explain what motivated each group to make the decisions they made.
2. Explain the impact of those decisions on the future of each group.
3. Which group is most like America, and why?
4. What does this case teach you?
g. Law of increasing opportunity cost:
1. What does it tell us?
2. How could it be explained graphically?
h. Explain how you could use the Production Possibility Model to represent the US Economy during 2008 - 2010.
Question 3. The Circular Flow Model with Government is another important model for students to understand.
a. Please explain what the model shows us.
b. List and explain the assumptions of the model.
i. There are 3 assumptions of the Circular Flow Model with Government. You should be able to list and explain each.
c. List and explain the characteristics of each component - be thorough. You should have at least 4 for each of the components!
i. Government sector - list and explain the characteristics
ii. Household sector - list and explain the characteristics
iii. Business sector - list and explain the characteristics
iv. Product market - list and explain the characteristics
v. Resource market - list and explain the characteristics
d. Thoroughly explain how each component of the model interacts with the other components - be thorough - this requires detail!
i. Explain how all of the sectors and markets interact with each other. You can do this as part of your answer to part ( c) if you like.
ii. Detail is critical here!
Question 4. Demand, Supply, Market Equilibrium
a. Please Thoroughly and completely explain the Law of Demand
i. Define demand and state the law of demand.
ii. List and explain the 3 factors that support the law of demand.
1. List and explain each of the 3 factors discussed in the slides.
iii. List and explain the determinants of demand and how each can either cause an increase in demand or a decrease in demand.
1. List and explain each of the 5 determinants and how they impact demand.
iv. Thoroughly and completely explain the differences between a change in demand and a change in quantity demanded.
1. You should be able to explain each of these cases and draw a picture of each case. Be sure you include the causes of the changes.
b. Thoroughly and completely explain the Law of Supply
i. Define supply and state the law of supply.
ii. List and explain the determinants of supply and how each can either cause an increase in supply or a decrease in supply.
1. There are 6 determinants of supply listed in the slide set. You should be able to list and explain how each shifts the supply curve to the left or right.
iii. Thoroughly and completely explain the differences between a change in supply and a change in quantity supplied.
1. You should be able to explain each of these cases. Be sure you include the causes of the changes!
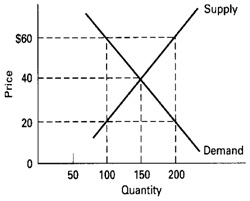
c. Thoroughly and completely explain the following graph of market equilibrium.
i. Explain what market clearing equilibrium means.
1. Explain what this really means. Please be thorough.
ii. Discuss what happens at a price above and below the equilibrium price, and why those things happen!!! Detail!
1. What if the price were above the equilibrium price - Explain what happens.
2. What if the price were below the equilibrium price - Explain what happens.
iii. Thoroughly and completely explain the two government intervention cases, price floors and price ceilings and give examples.
Question 5. In the discussion of the Market System we talked about the characteristics of the Market system and 4 Fundamental Questions that every economy must respond to.
a. List and thoroughly and completely explain those 4 fundamental questions and how they are answered.
i. What will be produced?
1. The following information should be included in your explanation of this first question.
- products that generate profits and why
- explain economic profits
- explain economic costs
- relate normal profit to economic profit and explain who gets the economic profit.
- define expanding industry
- define declining industry
- Consumer sovereignty - explain, what it really means and how it works to influence what gets produced?
ii. How will the goods and services be produced?
1. The following information should be included in your explanation of this second question -
a. Why must firms try to employ the most economically efficient production techniques?
2. For each of the following issues, please explain why they are important to a firm and how a firm might address each one:
a. Optimal plant location
b. Resource Prices
c. Resource Productivity
d. Transportation Costs
iii. Who will get the goods and services?
iv. How will the system accommodate change?
1. The following information should be included in your explanation of this fourth question.
a. start with the system in equilibrium
b. shock the system into a disequilibrium condition
i. Use a change in one of the determinants of demand.
c. Explain in detail, how the system adjusts to the change.
d. Explain how the system completes the adjustment process and returns to equilibrium, and what indicates a return to equilibrium.
b. Characteristics of the Market system.
i. Select any 5 of the characteristics of the Market system that we covered, and explain each of them. Be thorough!
ii. Explain how each characteristic you selected impacts the 1% versus the 99%.
Question 6. Market Failure.
a. State the definition of a market failure,
b. List and explain the 4 causes of market failure included in the slides, including how they actually lead to market failure. Don't miss this part!
c. State the definition of spillovers costs and give 2 examples
i. Define and explain spillover cost
ii. Give two example of a spillover cost situation and explain why your examples are correct.
d. Explain the economic effects of spillover costs
i. Provide specifics starting with the firm avoiding costs (how and why that happens) and conclude with the nature of the market failure.
e. Thoroughly and completely explain how spillover costs are corrected and how those solutions would actually work to solve the problem. Be specific.
f. State the definition of spillover benefits, give 2 examples.
i. Define and explain spillover benefit.
ii. Give two example of a spillover benefit situation and explain why your examples are correct. Be specific.
g. Explain the economic effects of spillover benefits.
i. Explain why the market demand curve understates true demand and what happens next leading to the market failure. Explain the nature of the market failure.
h. Thoroughly and completely explain how spillover benefits are corrected and the economic implications of the corrections.