Explain how a logit model can be estimated

Assignment Help Econometrics
Reference no: EM131890123

Questions:

1. Using a suitable empirical example, explain how a logit model can be estimated using maximum likelihood estimation.

2. Explain the difference between marginal effects at the averages and average marginal effects in the context of a probit model.

3. Using an empirical example, explain the use of a receiver operating characteristic analysis.

4. Using a numerical illustration if necessary, discuss the steps of the Hosmer-Lemeshow goodness-of-fit test in the context of the estimation of binary choice models.

5. A researcher estimates a logit regression model of the probability of exporting based on data from 300 firms (100 exporters and 200 non-exporters), and reports the following result:

fti = F(-1.24 + 0.560sizei + 0.262PROFi)

In the above function, Π^ denotes the estimated probability of exporting, F (.) is the logistic probability function, SIZE is log of firm size and PROF is log of profits. Give the precise expression for the average marginal effect of firm size on the probability of exporting.

6. Consider a multinomial logit model with four categories and two regressors. Write down the relevant conditional probabilities, and derive the expressions for calculating the marginal effects of the regressors.

7. What is the Independence of irrelevant alternatives (IIA) assumption in the context of multinomial models? Using an empirical illustration outline a testing procedure to test the IIA assumption.

8. Consider an ordered logit model with three categories and two regressors- one continuous and the other binary. Assuming that there are N cross-sectional observations, (i): Write the log likelihood function of the ordered logit estimator; (ii) Give the expression for the variance-covariance matrix of the resulting maximum likelihood estimator; and (ii) Give precise expressions for all relevant average marginal effects.

9. An economist asked 1580 workers to categorise themselves as unsatisfied (satisfied=0), neither unsatisfied nor satisfied (satisfied=1), moderately satisfied (satisfied=2) and very satisfied (satisfied=3). The individuals were also asked to report the number of hours they work per week (hours) and how much they earn (wages). Based on this information, the following ordered probit model of the determinant of individuals' work satisfaction is estimated:
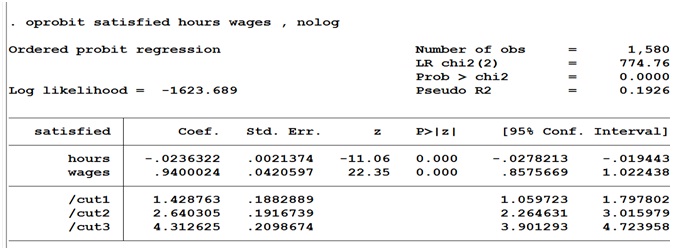
1444_Probit model.jpg

(i) Write down the log likelihood function used to estimate the model parameters, explaining all the notations you have used.

(ii) Based on the estimated model parameters, give the precise expressions for calculating the average marginal effect of wages on the probability of being moderately satisfied.

10. Using an empirical example, give a brief explanation of the estimation of alternative-specific conditional logit models, and the interpretation of the estimated regression parameters.

11. This is a computer exercise, and you need to access the mortgage default data (mortgage.dta) from the module's page. The idea is to estimate mortgage default models using different combinations of the following regressors: rate (interest rate); lvr (loan amount to value of property in %; insur (1 if borrower has mortgage insurance; 0 else); amount (loan amount in £100,000); credit (applicant's credit score); vrm (= 1 if variable rate mortgage, 0 if fixed).

(i) Estimate the 6 models specified in the table below, and fill in the empty columns.

Model

Link function

Regressors specification

AIC

BIC

Area under ROC

p-value Hosmer- Lemeshow

test:

1

Logit

All regressors entered linearly


2

Logit

Quadric terms in amount and credit; all other regressor entered linearly.


3

Logit

Amount and credit interacted with insur;

all other regressors entered linearly.


4

Probit

All regressors entered linearly


5

Probit

Quadratic terms in amount and credit; all other regressor entered linearly.


6

Probit

Amount and credit interacted with insur; all other regressors entered linearly.


(ii) Based on the completed table (or indeed on further estimations you might like to carry out), choose your preferred model. Based on the chosen model, generate some marginal effects and write a short report on your findings.

Program fragment using model 3 as an example:

1209_Program fragment.jpg

Verified Expert

This assignment is related to binary choice models where the dependent variable is a binary variable. There are two types of binary choice models- logit and probit model. The logit model uses sigmoid function and probit model uses cumulative normal distribution. The first 5 questions were on these two models. Then the material discussed multinomial logit model where choice are more than 2. 2 questions were regarding the model and its interpretation. Then there are ordered logit and probit models where the choices can be ranked according to the preference. The remaining questions were on ordered binary choice models and there estimation and interpretation.

Reference no: EM131890123

Questions Cloud

When designing a new thrill ride for an amusement park : When designing a new thrill ride for an amusement park, the designer must consider the sitting heights of males.
Calculate the deviations for the MapQuest estimates : ST 560 Midterm Exam - Untimed Component. Use the data to calculate the deviations for the MapQuest estimates then construct an appropriate graph
Sufficient evidence to warrant rejection : There is sufficient evidence to warrant rejection of the claim that the mean difference of post-test from pre-test is less than 0.
Determine the capital recovery cost of printer : Determine the capital recovery cost of printer. What is the variable cost per year? d) What is the EUAC of the printer?
Explain how a logit model can be estimated : Explain the difference between marginal effects at the averages and average marginal effects in the context of a probit model
How many standard deviations from the mean is john doe : How many standard deviations from the mean is John Doe, who is 65 inches tall?
Confidence interval for the true population mean package : Assume the population standard deviation is 6.1 ounces. Based on this, construct a 99% confidence interval for the true population mean package weight.
Confidence interval for the true population proportion : Out of 400 people sampled, 300 owned a pet. Based on this, construct a 95% confidence interval for the true population proportion of people who own pets.
Compute determination of chance probability payoffs : Compute determination of chance probability and respective payoffs. Build Small: Low Demand 0.4 ($40) = $16 High Demand 0.6 ($55) = $33 Build Large.

Reviews

len1890123

3/7/2018 12:32:48 AM

please answer the revision showing all steps and clearly as possible questions starting from page 51 Learning objectives: Based on the material in this study pack, you should be able to: 1. Explain the features of discrete choice models. 2. Discuss the estimation and interpretation of binary choice models. 3. Calculate marginal effects from discrete choice model. 4. Discuss the estimation and interpretation of unordered multiple choice models. 5. Discuss the estimation and interpretation of conditional logit models. 6. Discuss the estimation and interpretation of ordered choice models. 7. Conduct practical estimation of discrete choice models using microeconomic data.

Write a Review

Econometrics Questions & Answers

  Design a simple econometric research project

Design a simple econometric research project

  Multiplicative decomposition method

Multiplicative decomposition method

  Market for cigarettes

The Australian government administers two programs that affect the market for cigarettes.

  Solve the forecast model

Solve the forecast model

  What are the marginal abatement cost functions

What are the marginal abatement cost functions for each of the two areas? Calculate the loss in the two areas due to over-control (for the rural area) and under-control (for the urban area).

  Write the t statistic for testing the null hypothesis

Explain why this model violates the assumption of no perfect collinearity.  Write the t statistic for testing the null hypothesis

  What is economics system

What is economics system? What are the types of economics system? Briefly explain each type of economics system by giving examples of nations that are close to each type

  Multiple choice questions related to market concentration

Determine when a competitively produced product generates negative externalities in production, the industry will,

  Calculating number of units produced by firm

Assume a company has the following production function: Q = 100 K.5 L1 . Currently, the company hires 1,000 workers and employs 100 units of capital.

  Question about mobile commerce

M-commerce also known as mobile commerce is being lumped in with several strategic internet plans. Explain some of the industries that are likely to use mobile commerce and how it is working for them.

  Calculating the average days past due and average flow time

Auto Data manufactures custom engineering testing machine. The following 5-orders are currently in the design department:

  Mechanism of an english auction and second price auction

Briefly discuss the difference between mechanism of an oral or English auction and a Vickrey or second price auction.

Free Assignment Quote

Assured A++ Grade

Get guaranteed satisfaction & time on delivery in every assignment order you paid with us! We ensure premium quality solution document along with free turntin report!

All rights reserved! Copyrights ©2019-2020 ExpertsMind IT Educational Pvt Ltd