Reference no: EM131086036
Assessment: Individual Assignment
Task 1:
This task is on Microeconomics.
1) Go to LMS and download this short 12 minute video
https://www.youtube.com/watch?v=bBQVaRnHqLs
The link has also been sent to your email address and if you have any problems viewing it make sure you check with your friends or your teacher.
2) The video explains how different costs behave and relate to each other. After you have watched the video, fill in the missing information in the table below which describe the short run costs of an imaginary firm.
|
Output
|
TFC
|
TVC
|
TC
|
AFC
|
AVC
|
AC
|
MC
|
|
0
|
|
|
|
|
|
|
|
|
|
|
|
|
|
|
|
|
|
1
|
|
8
|
|
10.0
|
|
|
|
|
|
|
|
|
|
|
|
4
|
|
2
|
|
12
|
|
|
|
|
|
|
|
|
|
|
|
|
|
|
|
3
|
10
|
|
25
|
|
|
|
|
|
|
|
|
|
|
|
|
|
|
4
|
|
|
27
|
|
|
|
|
|
|
|
|
|
|
|
|
|
|
5
|
|
|
|
|
4.0
|
|
|
|
|
|
|
|
|
|
|
|
|
6
|
|
|
|
|
4.0
|
|
|
|
|
|
|
|
|
|
|
5
|
|
7
|
|
|
|
|
|
|
|
|
|
|
|
|
|
|
|
|
|
8
|
|
|
|
|
|
5.75
|
|
|
|
|
|
|
|
|
|
|
|
9
|
|
48
|
|
|
|
6.44
|
|
|
|
|
|
|
|
|
|
|
|
10
|
|
70
|
|
|
|
|
|
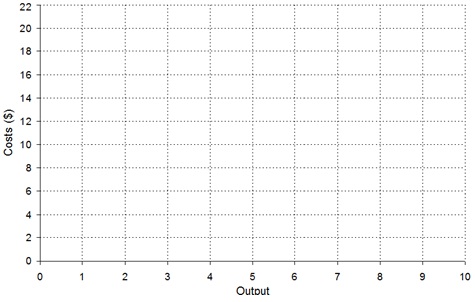
3) After you have completed the table above, use the information to draw/plot the Average Fixed Cost (AFC), Average Variable Cost (AVC), Average Cost (AC) and the Marginal Cost (MC) in the graph below.
Note that e.g. MC of 4 is inserted in between output of 1 and 2. The other MC's should similarly be inserted in between whole output numbers e.g. MC of 5 is inserted bewteen output of 6 and 7 for greater accuracy.
Task 2 (about 250 words)
This task is on Macroeconomics.
Based on what you learnt in Chapter 13 Inflation, and Chapter 14 Simple Model of the Macroeconomy, explain Demand-Pull inflation and Cost-Push inflation by comparing them. Your answer is expected to include the following:
- diagrams of the two kinds of inflation which must be hand drawn, then scanned or photographed and copied into your word-document assignment;
- an explanation of how demand or costs influence price levels and giving two demand-pull and two cost-push examples.
|
Find profit-maximizing prices-outputs for durable goods
: Assume that demand for services per period is Pt = 1000 − Qt where Qt is the stock of the durable consumed. Let the discount factor for consumers and the firm be given by δ. Find the profit-maximizing prices and outputs for a durable goods monopolist..
|
|
What is price elasticity of demand for this banks accounts
: Suppose a local bank increases the fees they charge for their bank accounts by 5 percent. In response, the demand for their bank accounts decreases from 35,000 to 5,000. What is price elasticity of demand for this bank's accounts?
|
|
Write an equation proposals - construct appropriate graphs
: Write an equation proposals - Construct appropriate graphs - Supply function given by equation QS = 3P - 50.
|
|
Provide a description about the target population
: Analyze how social, cultural, and behavior factors in the target population contribute to the health issue; and identify what factors/characteristics are positive or negative and which behaviors/practices/beliefs serve as risk factors or protectiv..
|
|
Explain demand-pull inflation
: MGE1108 ECONOMICS FOR BUSINESS - After you have completed the table above, use the information to draw/plot the Average Fixed Cost (AFC), Average Variable Cost (AVC), Average Cost (AC) and the Marginal Cost
|
|
Determine the tube surface temperature at the coil inlet
: For the prescribed heat dissipation, what is the required condensation rate (kg/s) and water flow rate (kg/s)?
|
|
Nominate a specific application lifecycle
: In your nomination, you must include information about how the ALM tool supports security requirements throughout the System Development Lifecycle (SDLC).
|
|
What does gdp really tell us about economic growth
: According to the article "What Does GDP Really Tell Us About Economic Growth," located in Topic Materials, Khan discusses the pitfalls of GDP. Describe how these pitfalls have affected the overall economic status of a country.
|
|
Implementing a database system for an organization
: This project involves designing and implementing a database system for an organization. The term project is made up of a series of four deliverables, each building towards the finished product.
|