Experiment - picket fence free fall

Assignment Help Mechanical Engineering
Reference no: EM131940958

Experiment - Picket Fence Free Fall

OBJECTIVE - Measure the acceleration of a freely falling body (g) to better than 0.5% precision using a Picket Fence and a Photogate.

888_figure.jpg

PRELIMINARY QUESTIONS

1. Inspect your Picket Fence. You will be dropping it through a Photogate to measure g. The distance, measured from one edge of a black band to the same edge of the next band, is 5.0 cm. What additional information will you need to determine the average speed of the Picket Fence as it moves through the Photogate?

2. If an object is moving with constant acceleration, what is the shape of its velocity vs. time graph?

3. Does the initial velocity of an object have anything to do with its acceleration? For example, compared to dropping an object, if you throw it downward would the acceleration be different after you released it?

PROCEDURE
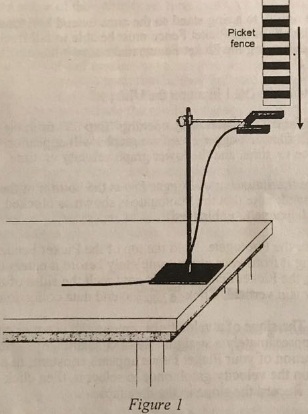
1. Fasten the Photogate rigidly to a ring stand so the arms extend horizontally, as shown in Figure 1. The entire length of the Picket Fence must be able to fall freely through the Photogate. To avoid damaging the Picket Fence, make sure it has a soft surface (such as a carpet) to land on.

2. Connect the Photogate to the DG 1 input on the ULI.

3. Prepare the computer for data collection by opening "Exp 05" from the Physics with Computers experiment files of Logger Pro. Two graphs will appear on the screen. The top graph displays distance vs. time, and the lower graph velocity vs. time.

4. Observe the reading in the status bar of Logger Pro at the bottom of the screen. Block the Photogate with your hand; note that the Photogate is shown as blocked. Remave your hand and the display should change to unblocked.

5. Click collect to prepare the Photogate. Hold the top of the Picket Fence and drop it through the Photogate, releasing it from your grasp completely before it enters the Photogate. Be careful when releasing the Picket Fence. It must not touch the sides of the Photogate as it falls and it needs to remain vertical. Click stop to end data collection.

6. Examine your graphs. The slope of a velocity vs. time graph is a measure of acceleration. If the velocity graph is approximately a straight line of constant slope, the acceleration is constant. If the acceleration of your Picket Fence appears constant, fit a straight line to your data. To do this, click on the velocity graph once to select it, then click M to fit the line y = mx + b to the data. Record the slope in the data table.

7. To establish the reliability of your slope measurement, repeat Steps 5 and 6 five more times. Do not use drops in which the Picket Fence hits or misses the Photogate. Record the slope values in the data table.

ANALYSIS

1. From your six trials, determine the minimum, maximum, and average values for the acceleration of the Picket Fence. Record them in the data table.

2. Describe in words the shape of the distance vs. time graph for the free fall.

3. Describe in words the shape of the velocity vs. time graph. How is this related to the shape of the distance vs. time graph?

4. The average acceleration you determined represents a single best value, derived from all your measurements. The minimum and maximum values give an indication of how much the measurements can vary from trial to trial; that is, they indicate the precision of your measurement. One way of stating the precision is to take half of the difference between the minimum and maximum values and use the result as the uncertainty of the measurement. Express your final experimental result as the average value, ± the uncertainty. Round the uncertainty to just one digit and round the average value to the same decimal place. For example, if your minimum, average and maximum values are 9.12, 9.93, and 10.84 m/s2, express your result as g = 9.9 ± 0.9 m/s . Record your values in the data table

5. Express the uncertainty as a percentage of the acceleration. This is the precision of your experiment. Enter the value in your data table. Using the example numbers from the last step, the precision would be

0.9/9.9 x100% = 9%

6. Compare your measurement to the generally accepted value of g (from a textbook or other source). Does the accepted value fall within the range of your values? If so, your experiment agrees with the accepted value.

7. Inspect your velocity graph. How would the associated acceleration vs. time graph look? Sketch your prediction on paper. Now change the upper graph to acceleration vs. time. Do this by clicking on the y-axis label. Select Acceleration, then deselect Distance and click OK. Comment on any differences. You may want to rescale the graph so that the acceleration axis begins at zero.

8. Using the acceleration vs. time graph on the screen, click on M to determine the average acceleration. How does this compare with the acceleration value for the same drop, determined from the slope of the velocity graph?

Reference no: EM131940958

Questions Cloud

Explain sampling technique discussed in the visual learner : Explain each sampling technique discussed in the Visual Learner: Statistics in your own words, and give examples of when each technique would be appropriate.
Discuss about the emotional and social development : Does the child meet the milestones and stages for the physical, cognitive, and social/emotional development? Why or why not?
How do you believe they would be ordered in the context : How do you believe they would be ordered in the context of the Christian biblical narrative? Refer to the lecture and topic readings in your response.
Explain in detail each part of the given narrative : What do the four parts of the Christian Biblical Narrative? Explain in detail each part of the narrative above and analyze the implications.
Experiment - picket fence free fall : Experiment - Picket Fence Free Fall Measure the acceleration of a freely falling body (g) to better than 0.5% precision using a Picket Fence and a Photogate.
Discuss the important differences in the facets : You will then explain how you will proceed to describe and interpret the important differences in the facets of yourself according to the integrator matrix.
Identify the challenges of working in interprofessional team : Identify the challenges of working in interprofessional team. Describe strategies to help people come together to function effectively as a collaborative team.
What qualities should a leader consider when building a team : What qualities should a leader consider when building a team? How might the considerations be different when the team is built to deal with a crisis?
Analyze the evolution of social media standards : Analyze the evolution of social media standards and practices and how it relates to the potential need for regulation of social media.

Reviews

Write a Review

Mechanical Engineering Questions & Answers

  Evaporating from a flat surface into species

Assume that the concentration profile for species A in  the  concentration  boundary  layer  is  of  the   form CA( y) = Dy2 + Ey + F, where D, E, and F are con- stants at any x-location and y is measured along a normal from the surface.

  Artificial aging on the materials

After days of testing the samples the hypothesis was proven to be correct. The natural aging process had the higher from the artificial aging on the materials, and the steel 1075 had the higher hardness value than the aluminum 2024.

  Simple inverting comparator circuit with hysteresis voltage

Design a simple inverting comparator circuit with a hysteresis voltage of 120 mv and adnominal threshold of +2.5 V. indicate component volues. A sensor provides temperature data as 360 mv/ c. Develop a comparator circuit that goes high when the tempe..

  Find combination of numbers of teeth and helix angle

For reasons of strength, it is desired to use gears with m = 10.0 mm in the normal plane. Determine a suitable combination of numbers of teeth and helix angle.

  Calculate the maximum velocity in the string

A string π m long is stretched until the wave speed is 40 m/s. It is given an initial velocity of 4 sin x from its equilibrium position. Determine the maximum displacement and state its location and when it occurs.

  Find the mass flow rate of air into the engine

Find the mass flow rate of air into the engine and If the velocity needs to be restricted to 150 [m/s] estimate the diameter of the restriction.

  Define the interactive role of the owner

Describe the differences between project objectives and project scope definition. Define the interactive role of the owner and designer in this process to ensure a well-defined understanding between the two parties.

  What are the readings for these three micrometers

In Figure 10-C, the sleeve-thimble region of three micrometers graduated in thousandths of an inch are shown. What are the readings for these three micrometers?

  Estimate the surface temperature of the chip

Estimate the surface temperature of the chip located 120 mm from the leading edge of the board when the board is operated in Mexico City. The dependence of various thermophysical properties on pressure is noted in Problem 6.22.

  What is the amount of recycle gas in mol per 100 kg of p if

to save energy stack gas from a furnace is used to dry rice. a gas containing 4.73 mol water is fed into the dryer as

  Phase of the product development process

Identify and understand each phase of the product development process: The assignment includes the practical application of the first few phases of a PD process.

  Derive an equation for the lines of constant declination

Derive an equation for the lines of constant declination in a sunpath diagram, for example, Figure 2.12. Check your equation by plotting a few declination lines on a piece of polar coordinate graph paper.

Free Assignment Quote

Assured A++ Grade

Get guaranteed satisfaction & time on delivery in every assignment order you paid with us! We ensure premium quality solution document along with free turntin report!

All rights reserved! Copyrights ©2019-2020 ExpertsMind IT Educational Pvt Ltd