Reference no: EM132374794
Assignment: Vowel Analysis
Aim
The aim of this assignment is to examine the acoustic phonetic properties of the citation-form vowels of a single speaker.
Learning Objectives
You will:
− demonstrate proficiency in the use of Praat to analyse acoustic phonetic data
− use standard spectrographic techniques to extract acoustic information from audio files containing your own vowel productions
− map acoustic data onto formant plots for the purpose of examining the relationship between vowels within and across consonantal context
− demonstrate an understanding of the concepts of formant, target, vowel space, vowel duration, monophthong, diphthong
− determine and compare vowel duration and demonstrate an understanding of inherent vs. contextual vowel length
Data
You will examine formant data from your own productions of English stressed vowels, produced in the /hVd/, /hVt/ and /hV/ contexts.
You will compare your own vowels with data established for relevant varieties of English, including Australian English. References and summary data from the AusTalk corpus are provided on iLearn.
All data analysis should be conducted in Praat, following the procedure described in the document <Praat Instructions>, and using the skills developed in workshops.
Procedure
1. Load your vowel dataset into Praat, and create a companion TextGrid with <Word>, <Vowel>, <Target>, and <Comment> tiers. Configure settings so that the formant tracking is optimized for your speech data and the spectrogram and waveforms are displayed clearly with appropriate ranges for vowel analysis.
2. For each item in your dataset (/hVd/, /hVt/ and /hV/ contexts), identify and annotate the word using information in the waveform and spectrogram.
3. For each word in your dataset (/hVd/, /hVt/ and /hV/ context), identify and annotate the vowel interval using information in the waveform and spectrogram.
The beginning of the vowel is determined by finding the point where voicing begins following the /h/. Some speakers have a great deal of overlap between the /h/ and the following vowel. If this is the case you must be consistent with the criterion you use to identify the boundary. You can choose to use the onset of periodicity or the beginning of F2. Use both the waveform and the spectrogram to establish the beginning of the vowel. A marked increase in amplitude usually accompanies the vowel onset.
The end of the vowel in /hVd/ and /hVt/ contexts is usually found by establishing the point where F2 and F3 end. Don't use F1 to establish the end of the vowel. Look at the waveform as well as this can provide important clues. An amplitude drop will usually accompany stop closure. It can be difficult to identify the end of a vowel in open syllables. Use the waveform and the end of F2.
4. Identify the acoustic target(s) for each vowel. This is typically the point in time where the formants are changing the least and are therefore close to horizontal in the spectrogram. The following criteria should be used to establish targets for both the monophthongs and the diphthongal components. Monophthongs have a single target and diphthongs have two targets:
high front vowels: F2 peak
low vowels: F1 peak
high back vowels: F2 trough
The Comments tier can be used to note any issues with tracking formants or locating targets or vowel limits.
5. Determine the frequency of F1 and F2 at each target. Record these values. An excel template has been provided to help you organise your data. Use integer values only.
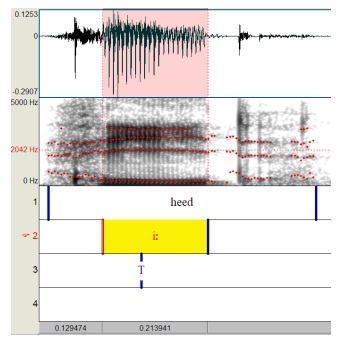
6. Determine the duration of each vowel in milliseconds. Capture and save an image of each vowel in which the vowel duration, spectrogram, formant tracks and target(s) are clearly displayed. The following image exemplifies how this information can be captured.
7. Plot the monophthong F1/F2 data to illustrate the vowel space for /hVd/, /hVt/, and /hV/ contexts separately. You MUST use the established procedure for plotting a vowel space illustrated in Harrington et al. (1997), and Cox (1999; 2006). Plots can be generated in Excel using the Scatter Plot function. You will have to reverse the axes to create a plot with the correct orientation. Plot /e?/ on the monophthong plot. A video has been provided on iLearn to show you how to create these plots.
8. On a separate graph, plot the schematic trajectories of the front rising diphthongs /æ?/, /?e/, /o?/ superimposed onto a copy of the monophthong vowel space generated above. Schematic trajectories are straight line estimates of diphthong movement through the vowel space from Target 1 to Target 2 (see Cox, 1999). Use arrows to indicate the direction of the movement.
9. On another separate graph, plot the schematic trajectories of the back rising diphthongs /æ?/, /??/ superimposed onto a copy of the relevant monophthong vowel space generated above for each context. Plot /??/ on this graph too.
10. Plot the durations for each vowel in /hVd/, /hVt/, and /hV/ contexts.
11. Compare the /hVd/, /hVt/, and /hV/ formant spaces, diphthong trajectories and durations
Report
Your assignment must be no longer than 1000 words, or 4 pages (single spaced, all margins 2cm, Times New Roman/Arial/Helvetica/Charis SIL/Doulos SIL 12pt font), not including tables, graphs and references.
Your response must be presented as a research report containing your Aims/hypotheses, a brief Introduction, Results, Discussion, Conclusions, and References. A method section is not required for this report but you should provide some information about the characteristics of the speaker, including general age, sex, and language background.
In the Introduction you should discuss the relationship between the formants and the vowel parameters of height and fronting and the value of presenting vowel information in the standard graphical way that indicates vowel space. You should also discuss the characteristics of inherent and contextual duration, i.e. as a feature of the particular vowel (inherent) and as a cue to consonant voicing (contextual).
For the Discussion, you should consider the following questions:
− how well (if at all) does your data fit the pattern of vowel relationships that have been established in the literature on Australian English? If your data diverges from this pattern, suggest an explanation.
? If you are not a native speaker of Australian English, can your native language/dialect explain the difference?
? If you are a speaker of Australian English, is there any evidence for unusual or innovative vowel productions, i.e. productions indicative of the direction of change established in the literature?
− how does the voicing context affect formant and durational values?
− what is the relationship between diphthong productions and monophthong productions? Do diphthong components appear to be related to particular monophthongs?
− what are the limitations of the analysis conducted here and how might it affect your ability to draw conclusions?
All figures, tables and graphs must be included in the report. An annotated spectrogram must be included for each vowel, showing clearly how it was analysed. Tables and spectrograms should be included as Appendices, but vowel plots and duration graphs should be presented as part of the Results. Marking criteria posted on iLearn provide more information about what is expected in your report.