Reference no: EM131411059
This is also Exercises 1 and 2. What sample size produces each of the following as the approximate margin of error?
a. Margin of error = .05 or 5%.
b. Margin of error = .30 or 30%.
Exercises 1
In given Case Study, the margin of error for the sample of 496 teenagers was about 4.5%. How many teenagers should be in the sample to produce an approximate margin of error of .05 or 5%?
Case Study 1.3
Did Anyone Ask Whom You've Been Dating?
"According to a new USA Today/Gallup Poll of teenagers across the country, 57% of teens who go out on dates say they've been out with someone of another race or ethnic group" (Peterson, 1997). That's over half of the dating teenagers, so of course it was natural for the headline in the Sacramento Bee to read, "Interracial dates common among today's teenagers." The article contained other information as well, such as "In most cases, parents aren't a major obstacle. Sixty-four percent of teens say their parents don't mind that they date interracially, or wouldn't mind if they did." There are millions of teenagers in the United States whose experiences are being reflected in this story. How could the polltakers manage to ask so many teenagers these questions?
The answer is that they didn't. The article states that "the results of the new poll of 602 teens, conducted Oct. 13-20, reflect the ubiquity of interracial dating today." They asked only 602 teens? Could such a small sample possibly tell us anything about the millions of teenagers in the United States? The answer is "yes" if those teens constituted a random sample from the population of interest.
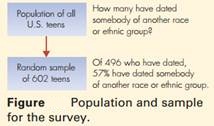
The featured statistic of the article is that "57 percent of teens who go out on dates say they've been out with someone of another race or ethnic group." Only 496 of the 602 teens in the poll said that they date, so the 57% value is actually a percentage based on 496 responses. In other words, the pollsters were using information from only 496 teenagers to estimate something about all teenagers who date. Figure above illustrates this situation. How accurate could this sample survey possibly be? The answer may surprise you. The results of this poll are accurate to within a margin of error of about 4.5%.As surprising as it may seem, the true percentage of all dating teens in the United States who date interracially is reasonably likely to be within 4.5% of the reported percentage that's based only on the 496 teens asked! We'll be conservative and round the 4.5% margin of error up to 5%. At the time the poll was taken, the percentage of all dating teenagers in the United States that would say they had dated someone of another race or ethnic group was likely to be in the range 57% 5%, or between 52% and 62%.
(The symbol is read "plus and minus" and means that the value on the right should be added to and subtracted from the value on the left to create an interval.) Polls and sample surveys are frequently used to assess public opinion and to estimate population characteristics such as the percent of teens who have dated interracially or the proportion of voters who plan to vote for a certain candidate. Many sophisticated methods have been developed that allow pollsters to gain the information they need from a very small number of individuals. The trick is to know how to select those individuals.
In Chapter 5, we examine a number of other strategies that are used to ensure that sample surveys provide reliable information about populations.
Moral of the Story: A representative sample of only a few thousand, or perhaps even a few hundred, can give reasonably accurate information about a population of many millions.
Definitions: A population is a collection of all individuals about which information is desired. The "individuals" are usually people but could also be schools, cities, pet dogs, agricultural fields, and so on. A random sample is a subset of the population selected so that every individual has a specified probability of being part of the sample. In a poll or sample survey, the investigators gather opinions or other information from each individual included in the sample. The margin of error for a properly conducted survey is a number that is added to and subtracted from the sample information to produce an interval that is 95% certain to contain the true value for the population. In the most common types of sample surveys, the margin of error is approximately equal to 1 divided by the square root of the number of individuals in the sample.
Hence, a sample of 496 teenagers who have dated produces a margin of error of about 1/ 5 .045, or about 4.5%. In some polls the margin of error is called the margin of sampling error to distinguish it from other sources of errors and biases that can distort the results. The next Case Study illustrates a common source of bias that can occur in surveys, discussed more fully in Chapter 5.
Exercises 2
About how many people would need to be in a random sample from a large population to produce an approximate margin of error of .30 or 30%?
|
Describe the employee programs
: Describe the employee programs that have helped this organization make the Top 100 list. Explain how the effectiveness of these programs can be measured
|
|
What are the core values of american government
: Define federalism and discuss how it relates to national and state sovereignty. What are the similarities and differences between today's version of federalism and the federalism that was established in 1787?What were the major goals of the framers..
|
|
Convenant between yahweh and the hebrews
: Compare this document with the instruction that the prophet samuel gives to the Hebrews in the convenant between yahweh and the hebrews. what similarities do you see in what the two religious leaders say yahweh and ahuramazda expect from those dev..
|
|
What is the margin of error for given poll
: What is a conservative 95% confidence interval for the population proportion that would have responded, "More of a threat?" Give your answer for the population percentage as well.
|
|
Examine a number of other strategies
: Could such a small sample possibly tell us anything about the millions of teenagers in the United States? The answer is "yes" if those teens constituted a random sample from the population of interest.
|
|
Discuss about the same sex marriage
: You need a research paper based on strictly facts!!! The topic is "Same Sex Marriage" It needs to be 3 written pages plus a title page and reference page so 5 pages in total. This paper needs to be in MLA format and again strictly facts (NO PERSO..
|
|
How might these technologies minimize risk
: How might these technologies minimize risk, promote health, and encourage patient engagement in their own care
|
|
Common prior to respective genocides
: What did Rwanda and Cambodia have in common prior to their respective genocides?
|
|
Create a research paper based on secondary sources
: Papers should be between 7-8 pages in length. Goals of the assignment are to demonstrate that you can create a research paper based on secondary sources and synthesize this material to present a cohesive answer to a question.
|