EX1010 - Introduction to MATLAB Assignment

Assignment Help MATLAB Programming
Reference no: EM132397083

EX1010 - Introduction to MATLAB Assignment - City University of London, UK

MATLAB Graphics Game Task -

You are required to submit two M-files that respond to the brief below. These files should be ready to be run in MATLAB to perform the tasks proposed in the brief.

You should not submit the numerical answers or the plots. Do not include any additional material apart from the two M-files because it will not be considered. However, you should include succinct comments within the M-files to explain the different parts and built-in functions that you are using, always respecting the rules for commenting in MATLAB. Only Moodle submissions will be considered. This work should be entirely your own. Any potential plagiarism (copying) will be investigated thoroughly. If plagiarism is found it will be treated a serious academic misconduct.

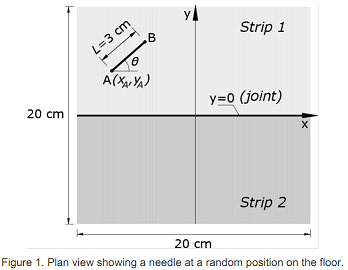
Problem - Consider a floor made of two parallel horizontal strips that are connected at y = 0. A straight needle of length L = 3 cm defined as a segment between the nodes A and B is dropped onto the floor and it stops at a random position given by the coordinates of its point A (xA, yA) and by its angle with respect to the horizontal line (θ), as shown in Figure 1.

1483_figure.png

You are asked to create a MATLAB M-file named "problem_XXX.m" (exactly like this, without capital letters or spaces, and substituting XXX by your full student number) that

1. Plots the needle at a random position on the floor considering that the point A of the needle can only be located in the square domain represented in Fig 1. This domain is a square of 20- cm centered at the origin of coordinates (x, y), as shown. The plot should be between -10 and 10 cm in the abscissas and in the ordinates. Use a solid black line to represent the needle and do not try to colour the background. Include a black horizontal line at y = 0. To represent the joint.

2. Uses a FOR loop to create a new plot with 50 needles distributed randomly on the floor. Use the same style and limits of the plot as in the previous section.

3. Counts how many of the 50 needles intersected (crossed) the joint of the floor in the previous plot and displays in the Command Window the proportion of the intersecting needles with respect to the total number of needles on the floor.

4. Creates a third plot that is the same as the second one but that represents the needles that intersect the joint in red colour and with a linewidth of 2 units, whilst the rest are plotted in black colour and with a linewidth of 1 unit. Use the same limits for the plot as in the previous sections.

Note: When running this file the three plots generated should appear in the screen. Hint: to avoid "losing" the first plot when the next one is generated you can use the command figure(). You are referred to the MATLAB Help for more information about how to use this command.

Note for curious minds: This is the Buffon's needle problem proposed by Georges-Louis Leclerc, Comte de Buffon, in the 18th century and it is the earliest problem in geometric probability that was solved. You can use your code to calculate the probability of a needle to lie across the line between the two strips of the floor (this is not part of the assessment). The solution of this probability is an approximation of the number π.

Reference no: EM132397083

Questions Cloud

Point-of-sale promotion on ballet flats : The shoe buyer ran a point-of-sale promotion on ballet flats for a Spring Sale weekend at 30% off. Here is what was sold during the sale:
Data originates from many sources : Data originates from many sources. Briefly summarize the types of data this activity may have generated.
Identify one core-competency : My group needs help with this question for our capsim report:
Short recap of problem you identified-cybercrime : A short recap of problem you identified -Cybercrime. Locate at least five scholarly peer-reviewed papers and at least three industry sources such as Websites.
EX1010 - Introduction to MATLAB Assignment : EX1010 - Introduction to MATLAB Assignment Help and Solution, City University of London, UK. MATLAB Graphics Game Task
Describe focus and the role that graduates are prepared for : Write 2 to 3 paragraphs, Comparing Psychiatric Nurse Practitioner and Family Nurse Practitioner, Identify each specialty and describe the focus and the role.
What are the pestel factors : 300 words on Identify and evaluate external influences that are positively and negatively affecting workforce needs in health care delivery.
Provide an example of toxic leadership in the workplace : Provide an example of toxic leadership in the workplace. Include a link to an article/video or describe the example for your peers.
Does having a competitive advantage mean : Does having a competitive advantage mean that a given company is better at creating economic value than its competitors? Explain why or why not.

Reviews

Write a Review

MATLAB Programming Questions & Answers

  Implement newtons method in matlab

Implement the secant method in Matlab and Implement Newtons method in Matlab

  Plot separate correlation functions of white noise data

Compute and plot separate correlation functions of white noise data and of sinusoidal data. Do this using both the biased and unbiased autocorrelation functions. Are the results what you expected?

  What is the difference between a script and function

Learn how to use various MATLAB built-in functions, What is the difference between a script and function? How do you create a new script or function in MATLAB

  Write a matlab code in the spirit of the pseudo-code

Write a MATLAB code in the spirit of the pseudo-code for row-oriented back substitution.

  Describe the algorithms you used to solve the problem

Describe the algorithms you used to solve the problem. Include (and justify) any simplifying approximations or assumptions you made in solving the problem.

  Write a driver script that runs the functions

Write a driver script that runs the functions above and using the least squares coefficients returned by the functions creates a single plot comparing the differences between the data and the two least squares fit.

  Generate the sequences using basic MATLAB signal functions

Generate the sequences using the basic MATLAB signal functions and the basic M ATLAB signal operations discussed in this chapter

  Write a matlab code using the switch statement

Solve the system of equations using the MATLAB functions or operators - Write a MATLAB script to plot the piece-wise function

  Construct the shear force and bending moment diagrams

Write the algorithm and draw the flowchart for each problem

  Create a matlab program

Create a MATLAB program that will use MATLAB's fzero function to determine d for the following parameters: R = 0.5 m and in steps of 0.1. Create a table consisting of S and d .

  Discuss the limitations of a linear classifier

Discuss the limitations of a linear classifier. What are some ways in which these limitations could be overcome - Discuss the limitations of the naive nearest neighbor algorithm. What are some ways in which these limitations could be overcome?

  Do principal component analysis for assignment

Do principal component analysis for assignment using MATLAB -  Each sample is one excel file. The samples are the metabolites that are in leaf, branch, different species, roots, etc in this one type of tree.

Free Assignment Quote

Assured A++ Grade

Get guaranteed satisfaction & time on delivery in every assignment order you paid with us! We ensure premium quality solution document along with free turntin report!

All rights reserved! Copyrights ©2019-2020 ExpertsMind IT Educational Pvt Ltd