Reference no: EM13143149
HD Inc. manufactures high definition plasma screen television sets. They are thinking of manufacturing a new fifty-two inch model. The HD Manufacturers Association provided the HD management team with the following estimated high definition TV demand function representing industry sales of fifty-two inch plasma televisions of the style HD wants to manufacture.
QT = 7000 - 4PT + 10PC - 5PS + .8Y + .8A - 1.8N - 260D
The meaning of each of the above variables is:
QT = the number of 52 inch HDTV sets demanded per month,
PT = the average price of each such set (in $),
PC = the average price of a competing set (in $),
PS = the average price of a cable connection capable of providing an HDTV signal (in $ per month),
Y = the average real annual disposable income of typical HDTV purchasers (in $),
A = the average annual advertising expenditure by manufacturers on HDTVs (in $),
N = the number of households already owning one or more such sets,
D = the number of HDTV sets per typical household owing them.
1. If all variables remain unchanged except the price of HDTVs (PT), which increases by $400, then quantity demanded of HDTVs will (state increase or decrease and by how much):
2. If the price of competing televisions (PC) decreases by $300, other things equal, then the demand (QT) for HDTVs will (state increase or decrease and by how much):
3. If the average real annual disposable income (Y) increases by $1000, then demand (QT) for HDTVs will:
a. increase by 80
b. increase by 800
c. decrease by 80
d. decrease by 800
4. Advertising (A) is considered:
a. a complementary good
b. a normal good
c. a non-price determinant of demand
d. a substitute good
5. The partial derivative of the function with respect to the number of households (N) already owning sets is:
a. -4 b. -5 c. -1.8 d. +0.8
6. Calculate the demand for HDTVs assuming variables have the following values:
PT = $1500 PC = $1000 PS = $50 Y = $40000 A = $200000
N = 5000 D = 0.3
7. Calculate the point cross price elasticity of demand with respect to the price of competing television sets (PC) at the values represented in question six.
8. Calculate the point income elasticity of demand for HD televisions at the values represented in question six.
9. Calculate the point cross price elasticity of demand for HD television sets with respect to the price of cable subscriptions (PS) at the values given in question six.
10. Calculate the own point price elasticity of demand at the point represented in question six (that is, when PT = $1500 and QT = the correct answer to question six).
11. If the price of HD televisions (PT) is increased slightly from the values given in question six, management can expect
a. an increase in revenue
b. a decrease in revenue
c. no change in revenue
d. since the elasticity cannot be determined, one cannot determine what will happen to revenue.
12. Calculate the arc price elasticity of demand between PT = $1500 and PT = $1000. Other variables have the values given in question six.
13. Here is a simple linear demand function: Q = 2000 - 50P . Derive its revenue function.
14. Derive the correct marginal revenue function (MR) for the revenue function in question 13.
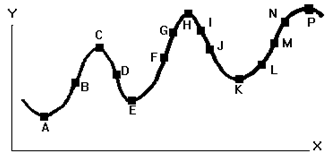
The curve below has nothing to do with any of the above or the Problem Situation. However, questions 15 & 16 utilize this curve.

15. Circle the letter below representing the point(s) on the above curve where the first derivative will be zero and the second derivative will be negative.
K L M N P
16. Circle the letter below representing a point(s) on the above curve where the first derivative may or may not be zero but the second derivative will be zero.
H J K M P
17. Here is a cubic function: Y = X3 + X2 + 5 . It has a relative maximum and minimum and an inflection point. Fill in each blank below with the value of X representing the point indicated (caution, these blanks are in no particular order):
a. an inflection point _______ b. a relative minimum _______ c. a relative maximum ______
Explain the strategy you used to identify the inflection point.
