Reference no: EM138007
1. A manufacturer of infant formula is running an experiment using the standard (control) formula, and two new formulas, A and B. The goal is to boost the immune system in infants. 120 infants in the study are randomly assigned to each of three groups: group A, group B, and a control group. There are 40 infants per group, and the study is run for 12 weeks. At the end of the study the variable measured is total IGA (in mg per dl), with higher values being more desirable. We are going to run a one-way ANOVA on these data. The hypotheses tested by the one-way ANOVA F test are
A. H0: the mean IGA score is the same for all three formulas.
Ha: the mean IGA score is higher for both treatment groups A and B than the control group.
B. H0: the mean IGA score is the same for all three formulas.
Ha: the mean IGA score is higher for at least one of the two treatment groups than the control group.
C. H0: the mean IGA score is the same for all three formulas.
Ha: the mean IGA score is not the same for all three formulas.
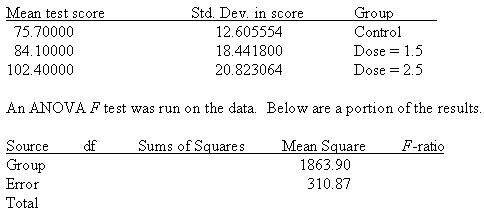
2. A researcher is studying treatments for agorophobia with panic disorder. The treatments are to be the drug Imipramine at the doses 1.5 mg per kg of body weight and 2.5 mg per kg of body weight. There will also be a control group given a placebo. Thirty patients were randomly divided into three groups of 10 each. One group was assigned to the control, and the other two groups were assigned to each of the two treatments. After 24 weeks of treatment, each of the subject's symptoms were evaluated through a battery of psychological tests, where high scores indicate a lessening of symptoms. Assume the data for the three groups are independent and the data are approximately Normal. The means and standard deviations of the test scores for the three groups are given below.

The P-value of the ANOVA F test is
A. greater than 0.10.
B. between 0.05 and 0.10.
C. below 0.05.
|
What is the radius of resulting circular path
: Bob, of mass m, drops from a tree limb at the same time that Esther, also of mass m, begins her descent down a frictionless slide. If they both start at the same height above the ground, which is true about their kinetic energies as they reach the gr..
|
|
Graphical method
: Formulate the above as linear programming problem. Solve (a) by graphical method. Solve using simplex method.
|
|
Find its average acceleration
: The rocket fires for 10 mins , after that the asteroid is moving at 30 degrees to its original path at the speed of 18 km/h/ Find its average acceleration.
|
|
The axis of rotation is at the inside of the curve
: How many revolutions per minute would a 29 {rm m}-diameter Ferris wheel require to make for the passengers to feel "weightless" at topmost point.
|
|
Evaluate the p-value of the anova f test
: The hypotheses tested by the one-way ANOVA F test - Evaluate the P-value of the ANOVA F test
|
|
How far will a point on the edge
: A water pipe is inclined 32.0° below the horizontal. The radius of the pipe at the upper end is 3.00 cm. If the gauge pressure at a point at the upper end is 0.117 atm, what is the gauge pressure at a point 2.65 m downstream, where the pipe has narro..
|
|
Prepare ledger accounts
: Explain what you understand by the term depreciation and it's relevance in the preparation of financial statements, Prepare ledger accounts, Prepare an income statement, Prepare a balanced sheet
|
|
How far from the objective lens is the object
: A microscope with an eyepiece lens of focal length 1.90 cm and an objective lens of focal length 1.15 cm is used to examine a section of the brain of a sacrificed rat. The distance between the lenses of the instrument is 24.0 cm and final image is vi..
|
|
Evaluate total sum of squares
: Reading highway signs is not always easy, especially if your vision is imperfect. Vision in general tends to deteriorate with age. Two researchers conducted a study to determine if the distance at which a standard highway sign could be recognized ..
|