Reference no: EM132855066
SEHS4629 Fluid Engineering - The Hong Kong Polytechnic University
Question 1. Both pipes in the system shown have an equivalent sand roughness ks of 0.10 mm and a flow rate of 0.1 m3/s, with D1 = 12 cm, L1 = 60 m, D2 = 24 cm, and L2 = 120 m. Determine the difference in the water-surface elevation between the two reservoirs.

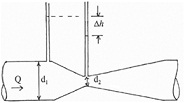
Question 2. (a) A Venturi Meter is to measure the flowrate of water in the pipeline. Based on the fundamental theory of Fluid Mechanics, you are required to derive the following expression to calculate the water flowrate in the pipe and show the meaning of the parameters in the equation:
Q = KA0√2gΔH
(b) The diameter of the water pipe is 200mm, the throat diameter of the Venturi Meter is 80mm and the flow coefficient is 0.85. If the pressure difference between the two measurement points is h =10cm of mercury, calculate the average velocity in the pipe. Assume the relative density of mercury is 13.6, i.e. the ratio of mercury density and water density.

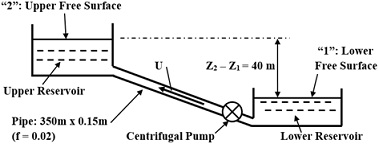
Question 3. (a) Water (density = 1000 kg/m3; viscosity = 1.15 x 10⁻³ N-s/m2) is transferred from the lower reservoir through a circular pipe of 350m long and 0.15m diameter to the upper reservoir as shown in Figure Q3(a) by installing a centrifugal pump of the following operation characteristics (refer to Table Q3(a)) when it is running at 1800 rpm. Difference between free water surfaces of the two reservoirs is 40 m. Friction factor of the pipe can be assumed to be constant at 0.02. Determine the power required from the electric motor driving the centrifugal pump by considering all loss. Accessories along the pipeline: entrance (k = 0.5); pump (k = 0.6); filter (k = 1.2); valve (k = 0.7); bend (k = 0.4); exit (k = 1).
Table Q3(a) Operation Characteristics of the Centrifugal Pump at 1800 rpm:
|
Volume Flow Rate, QQ, (m3/s)
|
0
|
0.02
|
0.04
|
0.06
|
0.08
|
0.1
|
|
Head Gain, HG, (m)
|
80
|
78
|
72
|
60
|
40
|
0
|
|
Pump Efficiency, ηη
|
0
|
0.6
|
0.8
|
0.8
|
0.6
|
0
|

Figure Q3(a) Pump and Pipe Flow Systems for Question 1
(b) Referring to the pump and pipe flow systems of Q3(a), it is aimed to replace the original centrifugal pump by another two identical centrifugal pumps, and each is of operation characteristics as shown in the following Table Q3(b) when it is running at 1600 rpm:
Table Q3(b) Operation Characteristics of Each Centrifugal Pump at 1600 rpm:
|
Flow Rate, QQ, (m3/s)
|
0
|
0.01
|
0.02
|
0.03
|
0.04
|
0.05
|
0.06
|
0.07
|
|
Head Gain, HG, (m)
|
65
|
62
|
57
|
51
|
42
|
32
|
20
|
0
|
Evaluate the overall operation characteristics curve of the two centrifugal pumps, and hence determine the volume flow rate through the pipe by assuming the system characteristics curve is unchanged when these two pumps are arranged to operate in: (i) Series; or (ii) Parallel.
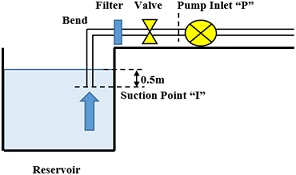
Question 4. A centrifugal pump was installed in last November to pump water from a reservoir as shown in Figure Q4. After installation, the pump has worked well during the whole winter. Recently, reports on observation of possible cavitation are received continuously in August. You are assigned to investigate the possible causes and required to recommend remedial actions.

Figure Q4 Pump System under Investigation
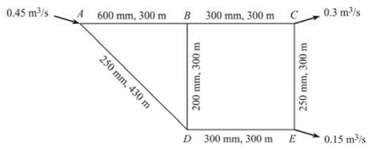
Question 5. For the given source and loads as shown in Figure Q5, determine the flow rate in each pipe. Besides, decide the pressures at the load points if the pressure at the source is 400 kPa. Assume all the pipes are horizontal and f=0.012 for all pipes.

Figure Q5 Pipe network
Question 6. Figure Q6.1 shows an isolation ward in a hospital for accommodating patents suffering from novel coronavirus pneumonia. For preventing spread of COVID-19, the isolation ward is to be maintained steadily at a pressure below the outdoor air pressure by the air-conditioning and mechanical ventilation (ACMV) system as shown in Figure Q6.1.
The fan total pressure of the air-handling unit (AHU) supply fan (FPS) and the exhaust fan (FPE) can be expressed as functions of the respective system flow rates (QS & QE) as follows:
FPS = a0 + a1Qs + a2Qs2 + a3Qs3
FPE = b0 + b1QE + b2QE2 + b3QE3
The relation between the pressure drop (?Pi) and the flow rate (Qi) for the other elements in the ACMV system (denoted as R1 to R6, see Figure Q6.2) can each be modeled as a flow resistance as follows:
?Pi = RiQi2
Note that R6 represents a volume control damper, and its flow resistance can be adjusted to balance the system such that the required air pressure in the isolation ward can be achieved.
Derive the necessary equations and explain the steps to be followed for determining the flow resistance required of the volume control damper R6 for achieving a target space pressure, Pw, inside the isolation ward.

Figure Q6.1 Layout of the isolation ward and the ACMV system

Figure Q6.2 Schematic diagram for the ACMV system
Attachment:- Fluids Engineering.rar