Reference no: EM138040
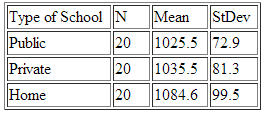
1. A researcher is interested in comparing SAT scores for students enrolled in public schools, private schools, and those home schooled. She selects a random sample of 20 high school students from each group and administers the SAT exam to them. She is interested in testing the null hypothesis that the mean SAT score is the same for each type of schooling using the one-way ANOVA. Some summary statistics for the three groups are given below.

The researcher computes the sum of squares for groups as SSG = 40030 and the sum of squares for error as SSE = 414780. The numerical value of the ANOVA F statistic is
A. 0.0965.
B. 1.83.
C. 2.75.
2. A researcher wished to compare the effect of the frequency of the rate of stepping on heart rate in a step-aerobics workout. A collection of 30 adult volunteers was randomly divided into three groups of ten subjects each. Each group did a standard step-aerobics workout with group 1 at a low rate of stepping, group 2 at a medium rate of stepping, and group 3 at a rapid rate. The mean heart rate at the end of the workout for all subjects was determined in beats per minute. Assume the data for the three groups are independent and the data are approximately Normal. The means and standard deviations of the heart rates for the three groups are given below.

An ANOVA F test was run on the data with the following results.
Analysis of Variance for heart rate.

Of particular interest to the researcher was the difference in average heart rate between the group that stepped at a rapid rate and the group that stepped at a medium rate, or the contrast . The numerical value of the t statistic for testing the null hypothesis H0: ψ = 0 is
A. 18.3.
B. 2.32.
C. 1.04.