Reference no: EM138122
1. A researcher was interested in determining whether incentives, and how they were offered, affected the response rate in surveys. A simple random sample of 50 adult residents of a large city was selected. All were mailed a survey. In half of the mailings a check was included as a token of appreciation (in advance) for completing the survey. Five of these checks were for $1.00, five were for $5.00, five were for $10.00, five were for $25.00, and five were for $50.00. In the other half, people were promised a check upon returning a completed survey. Five were promised a check for $1.00, five were promised a check for $5.00, five were promised a check for $10.00, five were promised a check for $25.00, and five were promised a check for $50.00. Which method of payment (check enclosed or check to be sent upon return of a completed survey) and the amount ($1.00, $5.00, $10.00, $25.00, or $50.00) each person received was determined by randomization. For each person who was sent one of the surveys, the researcher recorded whether or not a completed survey was returned.
Let x be the amount of the check (either enclosed or promised) and z be the indicator variable
We wish to fit a logistic regression model
where p is the binomial probability of returning a completed survey, and log is the natural logarithm. The multiple logistic regression output from fitting this model is given below.
A 95% confidence interval for the slope β1 is
A. 0.05903 ± 0.042156.
B. 0.05903 ± 0.02151.
C. -1.01641 ± 0.90260.
2. An SRS of 400 adults was taken. Each person was asked whether they had ever purchased an item over the internet. The gender of each person was also recorded. The results were
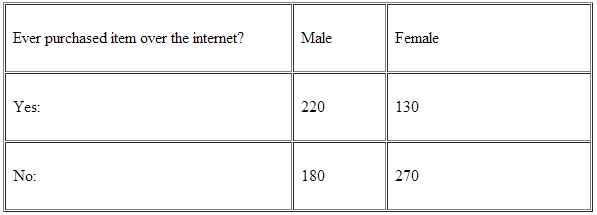
The odds that someone who has purchased an item over the internet is a male is
A. 0.63.
B. 1.7.
C. 1.22.
|
Terms of maintenance expense
: What other variables should be considered when determining what is reasonable in terms of maintenance expense
|
|
Explain why the food stamp program
: Explain why the food stamp program can have the same effect on the consumption pattern and well-being of recipients as an outright.
|
|
Such a price restriction
: How would a law preventing landlords from charging above $900 give different results. What is such a price restriction called.
|
|
Raise the required capital
: How many shares of common stock must be issued as well as at what price, to raise the required capital.
|
|
Evaluate the confidence interval for the slope
: each person received was determined by randomization. For each person who was sent one of the surveys, the researcher recorded whether or not a completed survey was returned.
|
|
Compare with single versus multiple bidders
: How do the buyer's returns compare with the method of payment, and how do they compare with single versus multiple bidders.
|
|
Net present value index
: Calculate the following: Rate of Return and Calculate the following: Net Present Value Index
|
|
Evaluate the results of the regression equation
: Evaluate the results of the regression equation tells managers and how it is likely to impact decisions made related to maximizing profitability.
|
|
Example on natural logarithm
: where p is the binomial probability of returning a completed survey, and log is the natural logarithm. The multiple logistic regression output from fitting this model is given below.
|