Reference no: EM13678526
Question 1: Graph, for -5 ≤ t ≤ 5, the following two continuous-time functions:
(a) g(t) = rect (t/3) + sin(4Πt + 2) and (b) g(t) = ramp(t)* sin(2Πt).
Question 2: Let a function be given by: g(t) = 4 t cos(10Πt), -2 ≤ t ≤ 2. Without analytically evaluating them, plot
(a) the even part of the function g(t)
(b) the odd part of the function g(t).
Question 3: Evaluate the average power for the signals:
(a) x(t) = 2 sin(200Πt)
(b) The periodic signal, with fundamental period T0 = 6, described over the time period 0 < t < 6 by
x(t) = rect(t-2/3)-4rect(t-4/2)
Question 4: Graph the following discrete-time functions:
(a) g[n] = 10 ramp[n/2] , for -5 ≤ n ≤ 10
(b) g[n] = Σnm=0 cos(2Πm/12)u[rn], for 0 ≤ n ≤ 36.
Question 5: Graph the following discrete-time functions: n < 0
(a) 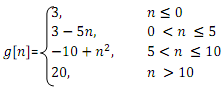
(b) g[n/2]
Question 6: Graph the following functions:
(a) g [n] = u[n] - 0.5u[n - 7]
(b) h[n] = u[n] - u[n - 4]
(c) Y[n] = g[n] * h[n]
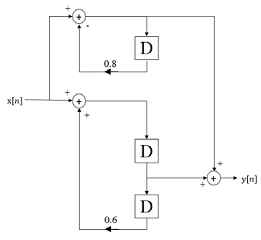
Question 7: Use MATLAB to find and to graph the unit-sequence response of the system given below
Question 8: A periodic signal x(t), with a fundamental period of 2 second, is described over one fundamental period by
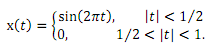
(a) Graph this signal over 2 fundamental periods.
(b) On the same plot, graph its Fourier series representation xN(t) given by
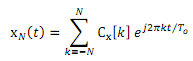
for N = 2, 4 and 10.
Question 9: A discrete-time signal is given by x[n] = sinc(n/8). Graph the magnitude and phase of the DTFT of x[n - 2] for the frequency range -0.5 to 0.5.
Note : In the sum, use n = -N:N, with N = 100,000.
Question 10: Graph the magnitude and phase of the DTFT of the signals x[n] and y[n]) (here y[n] is just a frequency shifted version of x[n]
(a) x[n] = cos(Πn/2), 0 ≤ n ≤ 100
(b) Y[n] = e∫Πn/4x[n].
Note: For both graphs, plot over the frequency range -1 to 1.