Reference no: EM131340036
Using the data in the following table for a number of firms in the same industry, do the following:
a. Compute the total asset turnover, the net profit margin, the equity multiplier, and the return on equity for each firm.
b. Evaluate each firm's performance by comparing the firms with one another. Which firm or firms appear to be having problems? What corrective action would you suggest the poorer performing firms take? Finally, what additional data would you want to have on hand when conducting your analyses?
|
|
Firm
|
|
in millions of dollars
|
A
|
B
|
C
|
D
|
|
Sales
|
$20
|
$10
|
$15
|
$ 25
|
|
Net income after tax
|
3
|
0.5
|
2.25
|
3
|
|
Total assets
|
15
|
7.5
|
15
|
24
|
|
Stockholder's equity
|
10
|
5.0
|
14
|
10
|
Q6
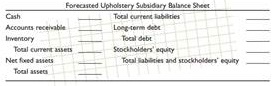
Tarheel Furniture Company is planning to establish a wholly owned subsidiary to manufacture upholstery fabrics. Tarheel expects to earn $1 million after taxes on the venture during the first year. The president of Tarheel wants to know what the subsidiary's balance sheet would look like. The president believes that it would be advisable to begin the new venture with ratios that are similar to the industry average.
Tarheel plans to make all sales on credit. All calculations assume a 365-day year. In your computations, you should round all numbers to the nearest $1,000.
Based upon the industry average financial ratios presented here, complete the projected balance sheet for Tarheel's upholstery subsidiary.
|
|
Industry Averages
|
|
Current Ratio
|
2:1
|
|
Quick Ratio
|
1:1
|
|
Net profit margin ratio
|
5%
|
|
Average collection period
|
20 days
|
|
Debt ratio
|
40%
|
|
Total asset turnover ratio
|
2 times
|
|
Current liabilities/stockholder's equity
|
20%
|
|
Determine how many dump trucks loads will be transported
: If each dump truck can transport 18 cubic yards, determine how many dump trucks loads will be transported? For calculation purposes, add a 15% "fluff factor" (add to the volume that will be transported).
|
|
Draw the graph relating the two variables
: Draw the graph relating the two variables - Does the data support the suggestion that engine size and fuel consumption are related? If so find the relationship between them and state the probable limits of the Regression Coefficient with 95% confi..
|
|
Compute tax loss on sale and related tax benefit
: An asset was purchased three years ago for $180,000. It falls into the five-year category for MACRS depreciation. The firm is in a 30 percent tax bracket. Compute the tax loss on the sale and the related tax benefit if the asset is sold now for $21,0..
|
|
Ring at the end of a chain that passes
: Two perpendicular forces act on a ring at the end of a chain that passes over a pulley and holds a crate. What is the weight of the crate if the horizontal force pulls at 92pounds and the vertical force pulls at 44 lb?
|
|
Evaluate each firms performance by comparing the firms
: Compute the total asset turnover, the net profit margin, the equity multiplier, and the return on equity for each firm. - Evaluate each firm's performance by comparing the firms with one another.
|
|
What is the time between current pulses
: Using data from Fig. 10-9a, calculate the power dissipated in the sample per unit volume when it is biased just below threshold if rc0 is chosen from the calculation of part (a). In general, does operation at a higher frequency result in greater p..
|
|
What part of the collection gives diminishing return and why
: What part of this collection gives diminishing returns and why? How does collection size relate to efficiency of management of the collection? When is it most valuable to preserve a plant species?
|
|
What are the benefits behind the valuation approach
: You are the controller for Bizbeet Corporation, and a few days ago you provided a draft of this year's financial statements to the chief executive officer (CEO) of the company, Mr. Bizbee. You used the valuation approach while creating the balance sh..
|
|
Describe three real situations from your environment
: Prepare a table in an MS Word document. The main heading is "Motivating Operations and Discriminative Stimuli." Then make two columns under that heading. Label the left column "How They Are Alike." Label the right column "How They Differ." Fill in..
|