Reference no: EM132382107
ETF5952 Quantitative Methods For Risk Analysis Assignment - Semester 2, 2019 - Monash University, Australia
Details of task: Answer problems regarding data analysis and decision making, which involves analytical exercise, computational tasks and interpretation.
Learning objectives assessed: Analytical exercise, computational tasks and interpretation.
Question 1 -
A government announced an auction to allocate three oil exploration areas in a region and company XYZ plans to bid for one of the areas. To win the auction for Area 1, 2 and 3, XYZ expects $550, $500 and $200 as a winning bid, respectively. The amount of oil produced from all the areas is random. At Area 1, XYZ could produce 10,000 litres oil with probability 0 3 and 2,000 litres with probability 0.7. At Area 2, XYZ could produce 5,000 litres oil with probability 0.4 and 4,000 litres with probability 0.6. At Area 3, XYZ could produce 4,100 litres oil with probability 0.8 and 3,900 litres with probability 0.2. The drilling cost (fixed cost) is $5,000. When XYZ buys an area, its profit is given by
Profit = p x A - B - 5000,
where p denotes the oil price per litre, A denotes the amount of oil from the area and B denotes the bid price for the area.
XYZ produces the following figure, given the price of oil being equal $1.50.
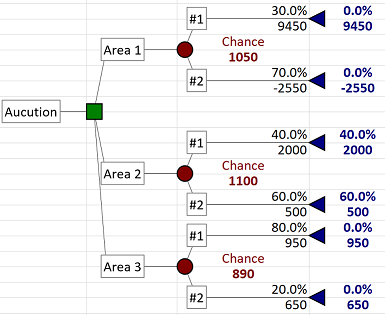
1. Suppose that XYZ is risk neutral. Obtain the optimal choice and the corresponding expected monetary value (EMV).
2. Suppose that XYZ use the Maximin criterion to choose an area. Obtain the optimal choice and the corresponding EMV.
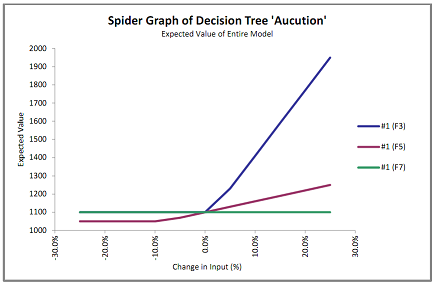
3. XYZ conducts a sensitivity analysis regarding probabilities of #1 of all three areas. The next page presents a spider figure, in which #1(F3), #1(F5) and #1(F7) indicates probabilities of #1 for Area 1, 2 and 3, respectively.
a. Explain why the three lines cross at the centre (no more than 25 words).
b. The red line, #1 (F5), becomes flat if changes are -10% or below. Explain why (no more than 25 words).
Question 2 -
Use the file, aribnb_MEL.csv, which contains data on houses/apartment listed in Airbnb in Melbourne. The data set contains the following variables:
- price: price
- bathrooms: the number of bathrooms
- accommodates: the number of accommodates
- bedrooms: the number of bedrooms
- review_scores_rating: rating score
- room_type: type of room
1. Estimate and report a linear regression model with the dependent variable of price and with regressors of bathroom, accommodates, bedroom, and review_scores_rating. Explain carefully an effect of bedrooms on price (no more than 30 words).
2. Create a dummy variable which takes 1 if room_type is Entire home/apt and zero otherwise. Then, Estimate and report the linear regression model in 1 additionally with the dummy variable. Explain carefully an estimated coefficient of the dummy variable (no more than 30 words). (Hint: To create a dummy variable in R, you can use (data_name$variable_name == value), which gives you TURE or FALSE, and also if value is character, you have use double quotation.)
3. From Assignment 1, we know that the price contains outliers and it is better to mitigate outliers' effect. For this end, we consider an application of log transformation. Try to estimate the linear regression model with the dependent variable of log price and the same regressors as in 3. Explain whether it is possible and why (no more than 30 words).
4. To implement the idea explained in 3, we decided removing observations causing the trouble. Estimate and report a linear regression model. Explain carefully an effect of bedrooms on price (no more than 30 words.)
Question 3 -
We use a data set for analysing chronic kidney disease. The data set comes from the Machine Learning Repository1, while the data set, kidney-clean.csv, at Moodle is cleaned up. The outcome of interest is "class", which takes "ckd" for chronic kidney disease and "notckd" otherwise. For classification, we consider blood pressure (bp) and diabetes mellitus (dm).
1. Obtain and report summary statistics of the three variables: class, bp and dm.
2. Estimate and report a logit model to predict chronic kidney disease with the regressors: bp and dm. Use "glm" function. Given the estimation result, explain contributions of the two factors (regressors) to kidney disease (no more than 15 words).
3. Estimate and report a CART model for predict chronic kidney disease with the same regressors above (you can report only a tree figure). Using all information obtained from the estimated tree, explain each end node (leaf) (no more than 30 words for each node).
Question 4 -
We analyse returns (%) from a portfolio consisting of the index of Australia's top 200 companies (ASX200) and a hypothetical safety asset. The data set, asx.csv, contains monthly return rate on ASX200. Use the data on "return" to answer questions.
1. Report means, standard deviations and Value-at-Risk 5% of the monthly returns in the data set.
2. Consider a relatively safe financial asset, which has a half of average return of ASX200 but a half of its standard deviations. To access financial portfolio based on pairs of ASX200 and the safe asset, obtain simulation outcomes under the assumption that the pair follow normal distributions with parameters estimated in 1. Let their correlation coefficient is -0.5. Consider the three cases:
a. 0.5 ASX200 and 0.5 Safe Asset
b. 0.2 ASX200 and 0.8 Safe Asset
c. 0.8 ASX200 and 0.2 Safe Asset
To report simulated outcomes (1000 iterations), present a table that includes means, standard deviations, minimum, maximum and VaR5%. Compare portfolios a-c and explain which portfolio is the most risky or the least risky (50 words or less).
3. Suppose that you want to maximize the expected return from the portfolio that consists of two financial products out, while restricting the VaR5% to be -4% or higher. Obtain the optimal portfolio and report a table including your portfolio choice (weight), its mean return, minimum, maximum and standard deviation. (You can choose any pair as long as you can satisfy the restriction).
Note - Typo: In Question 2.3. "the same regressors as in 3" should be "the same regressors as in 2". The tutor usually use R studio software with using R script and excel in class and maybe you need to use these software to do the assignment. Showing all calculation to answer these questions is very important and necessary. Also is important if you need to use the charts for these questions should be included with title and x lable and Y lable.
Word limit - Less than 5 pages (the main text).
Attachment:- Risk Analysis Assignment Files.rar