Estimation and testing of capital asset pricing

Assignment Help Econometrics
Reference no: EM13375791

Estimation and Testing of Capital Asset Pricing Model

 The capital asset pricing model (CAPM) is an important model in the field of finance. It explains variations in the rate of return on a security as a function of the rate of return on a portfolio consisting of all publicly traded stocks, which is called the market portfolio. Generally the rate of return on any investment is measured relative to its opportunity cost, which is the return on a risk free asset. The resulting difference is called the risk premium, since it is the reward or punishment for making a risky investment. The CAPM says that the risk premium on security j is proportional to the risk premium on the market portfolio. That is,

rj - rf = βj(rm - rf)

where rj and rf are the returns to security j and the risk-free rate, respectively, rm is the return on the market portfolio, and βj is the jth security's ''beta'' value.

A stock's beta is important to investors since it reveals the stock's volatility. It measures the sensitivity of security j's return to variation in the whole stock market. As such, values of beta less than 1 indicate that the stock is ''defensive'' since its variation is less than the market's. A beta greater than 1 indicates an ''aggressive stock.'' Investors usually want an estimate of a stock's beta before purchasing it. The CAPM model shown above is the ''economic model'' in this case. The ''econometric model'' is obtained by including an intercept in the model (even though theory says it should be zero) and an error term,

rj - rf = αj + βj(rm - rf) + e

Estimate the model for each stock. The corresponding Eviews outputs for all 6 regressions should be attached at the back of your report.

Finance theory suggest that αj = 0 under market efficiency. This is because αj represents excess profit or loss when the market excess return rm - rf = 0. That is, if αj > (<) 0, the stock consistently outperforms (underperforms) the market. However, if the market is efficient, this profit (loss) should disappear rather quickly by arbitrage.

1. Test the null hypothesis that αj = 0 for Microsoft, against an appropriate alternative hypotheses.

"Tech stocks typically have higher beta. An example is the dot-com bubble. Although tech stocks did very well in the late 1990s, they also fell sharply in the early 2000s, with a much worse decline than that of the overall market."

2. The above statement implies that Microsoft (a Tech stock) is an aggressive stock. Evaluate this claim by conducting an appropriate test on their β values.

"Mobil-Exxon" is an oil company with stable business conditions and should be a safer investment than the overall market"

3. The above statement implies that Mobil-Exxon is a defensive stock. Evaluate this claim by conducting an appropriate test on its β.

Based on the estimation results, fill out the following table:

1211_Estimation and Testing of Capital Asset Pricing Model.png

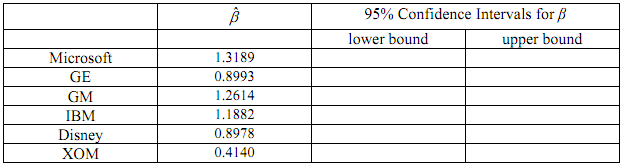
4. Show your working for all confidence intervals above.

5. Interpret the 95% confidence intervals for GE, GM, and Disney, paying attention to their risk profile (aggressive, defensive, neutral)

It is supposed that, for January 2009, the market return (rm) is expected to be either 0.05 (5%) with the probability 0.5; or -0.05 (-5%) with the probability 0.5. Assume the risk-free rate to be 0 and α values to be 0.

6. Calculate the expected returns and standard deviations from Microsoft and Mobil- Exxon stocks for January 2009. If you wish to minimize your risk (measured by standard deviation), which stock would be your preferred investment?

7. An investor is seeking your recommendation to invest in three stocks among the above. Her goal is to form a portfolio of three stocks with well-diversified risk profiles. State your recommendations and justify your choice in relations to the properties of β values found above.

"Using beta as a measure of relative risk has its own limitations. Most analysts consider only the magnitude of beta. Beta is a statistical measure and should be considered with the model's goodness-of-fit (R2 value of the regression). Higher R2 value implies a stronger relationship between stock return and market portfolio."

8. Critically evaluate the merit or otherwise of the above statement by commenting on the R2 values of the estimated CAPM regressions above.

Reference no: EM13375791

Questions Cloud

1 marginal revenue product is defined as the change in : 1. marginal revenue product is defined as the change in total revenue that results from the employment of an additional
Custom limousines co custom buys cadillac escalades from : custom limousines co. custom buys cadillac escalades from general motors and converts them into limousines a process
1 angela bates who works in a duplicating photocopying : 1. angela bates who works in a duplicating photocopying establishment for 20000 per year decides to open a small
1 comparing the different models of pure perfect : 1. comparing the different models of pure perfect competition and oligopoly what will be the effects or difference
Estimation and testing of capital asset pricing : estimation and testing of capital asset pricing modelnbspthe capital asset pricing model capm is an important model in
1-national parks are typically considered to be common : 1-national parks are typically considered to be common national resources. since each national park has a gated
Answer each of the following question in one or two : answer each of the following question in one or two paragraphs.1-describe the difference between average revenue and
After two quarters of increasing levels of production the : after two quarters of increasing levels of production the ceo of canadian fabrication amp design was upset to learn
Q1 specify an identity for changes in netforeign wealth as : q1. specify an identity for changes in netforeign wealth as a function of gross national product gnp using notationand

Reviews

inf375791

5/11/2017 5:36:16 AM

Not at all like different services, ExpertsMind does not require huge amounts of your own data and long request shapes. I feel entirely secure with these guys. That was my mistake i could not provide them correct file. Keep it up!

inf375791

5/11/2017 5:35:39 AM

could you please add the eview output chart for us. it is very important. when I can receive the solution? could you please as soon as possible. This is eview date about the Econometrics 22907474_1date.wf1 can you downlond my file? just let me know 22907413_1dte.wf1 can you downlond this zip file? 22907419_1????zipped??? 2.zip

Write a Review

Econometrics Questions & Answers

  Who was charging the monopoly price per beer

Illustrate that the previous manager, who was charging the monopoly price per beer, was not maximizing profits as accused by the owner. That is, find an alternate pricing scheme that results in more profits per customer than the monopoly scenario.

  What is the profit maximizing level of profit for the firm

Demand: Q=225-15*P Costs: 300 + 12Q + 0.5Q2(superscript) a. What is the marginal revenue function for this firm b. What is the marginal cost function for this firm c. What is the profit maximizing level of output

  What are the equilibrium quantity and price in the market

Determine the quantity demanded,the quantity supplied, and the magnitude of the shortage if a pride ceiling of $30 is imposed in this market. Also, determine the full economic price paid by consumers. What are the equilibrium quantity and price in ..

  Determine an optimal two-part tariff for a firm

An amusement park, whose customer set is made up of two markets, adults and children, can be expressed in equation form as follows (where subscript A refers to the adult market, subscript C to the market for children

  What savings rate would be needed in order for the economy

Suppose that the economy under study has the following characteristics: s = 0.30 n = 0.02 g = 0.10 d = 0.03K = 1600 Y = 800 N = 100 A = 2 Y = F(K, N, A) = AF(K, N) = A(K^(1/2))(N^(1/2))

  What is atc per unit for each level of output listed

Assume that the most efficient production technology available for making vitamin pills has the cost structure given in the following table. Note that output is measured as the number of bottles of vitamins produced per day and that costs include ..

  Find the bayes nash equilibrium in the game

Firm A has done a market study and knows whether demand is high or low, but Firm B does not. The two firms choose quantities simultaneously. Find the Bayes Nash equilibrium in this game.

  Find x compound interest at an effective annual rate

A discounted note of face value amount X, due in one half year, is valued today at $4992. Find X using a) Compound interest at an effective annual rate of 8% and b) simple interest at an annual rate of 8%. Which results with a higher value of X

  What is the marginal cost of the first worker

You have been hired to manage a small manufacturing facility whose cost and production data are given in the table below. Workers Cost Output Revenue 1 $300 50 $350 2 600 140 675 3 900 ..

  Why did one measure decrease while the other increase

Real GDP was $4719 billion in year 1 and $4848 billion in year 2. In contrast real GDP per ca pita in year 1 was $19261, but in year 2 it was only $19162. Why did one measure increase while the other measure decreased

  What real rate of return will the investor receive

Ten years ago a machine cost $800,000. Now, the same machine costs $1,200,000. Calculate the average rate of inflation per year.2) An investor bought a tax-free provincial bond, at a cost of $1000 which will pay $50 interest each year for 20 years...

  Develop a graph for the new demand and supply curves

Assume market demand increases and that the new demand curve is nowQd = 50 - P. Further assume the government provides to eachfirm, a subsidy of $40 per unit of output produced. Thus the supply curve now becomes Qs = 10 + 2(P+40).

Free Assignment Quote

Assured A++ Grade

Get guaranteed satisfaction & time on delivery in every assignment order you paid with us! We ensure premium quality solution document along with free turntin report!

All rights reserved! Copyrights ©2019-2020 ExpertsMind IT Educational Pvt Ltd