Reference no: EM131021347
Section 1.1
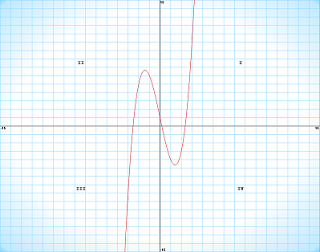
Using a calculator or computer, graph the functions. Describe briefly in words the interesting features of the graph including the location of the critical points and where the function in increasing/decreasing. Then use the derivative and algebra to explain the shape of the graph.
1. f(x) = x3 - 6x + 1
Try graphing the x values from -5 to 5 with the major unit of 1, and the y values from -40 to 40 with the major unit of 10.

First Derivative: f'(x) = 3x2 - 6
Critical Points: f'(x) = 0
3x2 - 6 = 0
3x2 = 6
x2 =2
x = ±√2
x ≈ ±1.4142
The critical points divide our graph into how many regions? three
X < -2.49 -1.41 < x < 1.41 x > 2.4
You will now substitute a point from each of these regions into the derivative to determine whether the function is increasing or decreasing on that interval.
f'(x) = ?? f'(?) = ?? f'(?) = ??
f is ??? f is ??? f is ???
Second Derivative: f''(x) = ???
You can now substitute your critical points into the derivative to determine if the graph is concave up or concave down at that point.
f''(?) = ??? f''(?) = ???
Concave ??? Concave ???
Local Min/Max Delete the incorrect one! Local Min/Max
Point: (??, ?? ) (??, ??)
2. f(x) = x · In(x), x > 0
Try graphing the x values from 0.1, 1, 2, 3, 4, 5 with the major unit of 0.5, and the y values from -1 to 8 with the major unit of 1.
Please insert your graph here.
First Derivative: f'(x) = ???
Critical Points: f'(x) = 0
?? = 0
x = ???
x ≈ ???
The critical point divides our graph into (how many?) regions:
X < ?? x > ??
You will now substitute a point from each of these regions into the derivative to determine whether the function is increasing or decreasing on that interval.
f'(?) = ?? f'(?) = ??
f is ??? f is ???
You can now substitute your critical points into the derivative to determine if the graph is concave up or concave down at that point.
Second Derivative: f''(x) = ???
f''(?) = ??
Concave ???
Local Min/Max (delete the incorrect one!)
Point: (??, ??)
Section 1.2
Use the first derivative to find all critical points and use the second derivative to find all inflection points. Use a graph to identify each critical point as a local maximum, a local minimum, or neither.
1. f(x) = x4 - 8x2 + 5
First Derivative: f'(x) = ??? Critical Points: f'(x) = 0
??????? = 0
4x(?????) = 0
??? = 0 ????? = 0
x = ?? x2 = ???
x = ±?????
Second Derivative: f''(x) = ???
You can now substitute your critical points into the derivative to determine if the graph is concave up or concave down at that point.
f''(x) = ??? f''(?) = ??? f''(?) = ???
Concave ??? Concave ??? Concave ???
Local Min/Max Local Min/Max Local Min/Max
To find inflection points, you must set the second derivative equal to zero and solve it!
Inflection Points: f''(x) = 0 ??????? = 0
4(????) = 0
??? = ???
???? = ???
x = ±√? / ?
x = ≈±???
Try graphing the x values from -4 to 4 with the major unit of 1, and the y values from -20 to 60 with the major unit of 20.
Please insert your graph here.
2. For f(x) = x3 - 18x2 - 10x + 6, find the inflection point algebraically. Graph the function with a calculator or computer and confirm your answer.
First Derivative: f'(x) = ???
Second Derivative: f''(x) = ???
Inflection Points: f''(x) = 0
????= 0
???? = ???
x = ???
Try graphing the x values from -4 to 20 with the major unit of 2, and the y values from -1000 to 500 with the major unit of 500.
Please insert your graph here.
Section 1.3
1. For f(x) = x - ln(x), and 0.1 ≤ x ≤ 2, find the value(s) of x for which:
(a) f(x) has a local maximum or minimum. Indicate which ones are maxima and which ones are minima.
First Derivative: f'(x) = ????? 0.1 ≤ x ≤ 2
Critical Points: f'(x) = 0
??? = 0
??? = ???
x = ???
Second Derivative: f''(x) = ??????? = ??????, 0.1 ≤ x ≤ 2
f''(?) = ???
Concave ???
Local Min/Max (delete the incorrect one!)
There is much debate over labeling an endpoint of an interval as a "local" minimum or maximum. Therefore, we will not classify x = 0.1 or x = 2 as such.
(b) f(x) has a global maximum or global minimum.
Critical Point and End Point Values: f(?) = ?? f(?) = ?? f(?) = ???
??? is the global max
??? is global min
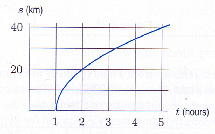
2. The distance, s, traveled by a cyclist, who starts at 1 pm, is given in Figure 4.34. Time, t, is in hours since noon.

(a) Explain why the quantity, s/t, is represented by the slope of a line from the origin to the point (t, s) on the graph.
(b) Estimate the time at which the quantity s/t is a maximum.
At the point (?, ?), the value of s/t is ?? km/hr - ?:?? pm.
(c) What is the relationship between the quantity s/t and the instantaneous speed of the cyclist at the time you found in part (b).
The quantity s/t is the ?????.