Reference no: EM131103992
1. For each graph, is the graph symmetric with respect to the x-axis? y-axis? origin?(No explanation required. Just answer Yes or No to each question.)
(a)
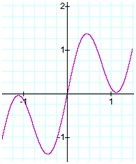
Symmetric with respect to the
x-axis? ____
y-axis? ____
origin? ____
(b)

Symmetric with respect to the
x-axis? ____
y-axis? ____
origin? ____
2. Let f(x)=1/2 |x|-1. (no explanation required)
(a) State the zero(s) of the function. ________
(b) Which of the following is true? 2. ______
A. f is an even function.
B. f is an odd function.
C. f is both even and odd.
D. f is neither even nor odd.
3. Which of the following equations does the graph represent? Show work or explanation.
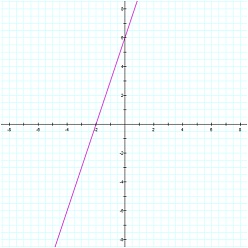
A. y=3x+6
B. y=-3x+6
C. y= 1/3 x+6
D. y=- 1/3 x+6
4. Consider the points (6, -1) and (-3, 2).
(a) Find the slope-intercept equation of the line passing through the two given points. Show work.
(b) Graph the line you found in (a), either drawing it on the grid in the previous problem #3, or generating the graph electronically and attaching it.
(c) Compare your line for this problem, #4, with the line in the previous problem #3. Are the two lines parallel, perpendicular, or neither parallel nor perpendicular? (The terms parallel and perpendicular are discussed on pages 166 and 167.) No explanation required - just state the answer.
5. George went on a diet. George's weight w in pounds t weeks after the start of the diet is modeled by
w(t) = -0.016t2 - 0.2t + 278 for 0 ≤ t ≤ 25 weeks.
Find and interpret the average rate of change of w over the interval [0, 25]. Show work.
6. Carla wants to hire a handyman to do some yard work at her home on a Saturday. Two individuals offer different deals:
Andy's charge: Pay a fee of $25, plus $18 per hour
or Bob's charge: Pay a fee of $15, plus $22 per hour
(a) State a linear function f (x) that represents Andy's total charge for a job taking x hours.
(b) State a linear function g(x) that represents Bob's total charge for a job taking x hours.
(c) Carla estimates it will take 7 hours to complete the yard work, and wants it done as cheaply as possible. Which individual should she hire? Show work/explanation.
(d) For what number of hours is the total charge exactly the same for both Andy and Bob? Show algebraic work/explanation.
(e) Fill in the blanks:
Andy's total charge is the cheaper option if the job requires ________(choose less or more) than ______ (enter number) hours.
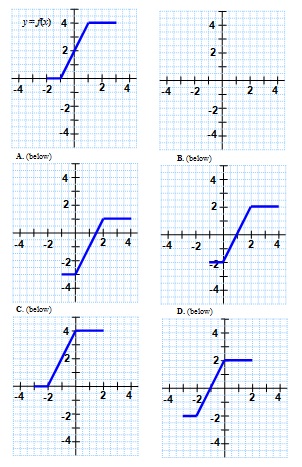
7. A graph of y = f (x) follows. No formula for f is given.
Which graph (A, B, C, or D) represents the graph of y = f (x + 1) - 2 ?
BRIEFLY EXPLAIN how you have decided which graph is the correct one.
(Grid supplied for scratch work; You are NOT required to submit your own graph)
8. Consider the graph of the piecewise function y = f (x) pictured below.
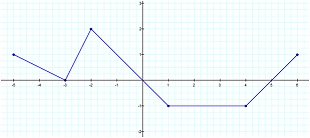
State the value of f (2).
(b) State the x-intercept(s), if any.
(c) State the y-intercept(s), if any.
(d) State the domain of the piecewise function.
(e) State the range of the piecewise function.
(f) State the interval(s) on which the function is increasing. That is, for what x-values is the function increasing?
(g) State the interval(s) on which the function is decreasing. That is, for what x-values is the function decreasing?
9. Based on data from L. Brown, Vital Signs 2003: The Environmental Trends that are Shaping our Future, the following chart of cigarette smoking data has been prepared.
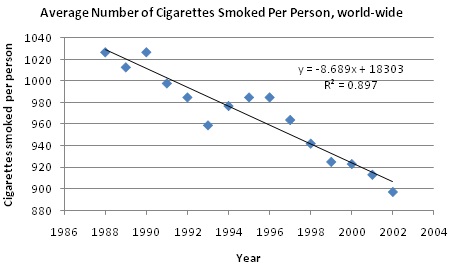
The line of best fit, the regression line, is y = -8.6893x + 18,303, where x = year and y = average number of cigarettes smoked per person, world-wide. The value of r2 is 0.8978.
(a) Use the regression line to estimate the average number of cigarettes smoked per person in 1988, to the nearest integer. Show some work.
(b) Use the regression line to estimate the average number of cigarettes smoked per person in 2001, to the nearest integer. Show some work.
(c) In what year (to the nearest year) does the regression line estimate an average number of cigarettes smoked per person of 880 cigarettes per person? Show work, solving an appropriate equation.
(d) What is the slope of the regression line and what are the units of measurement? In a sentence, interpret what the slope is telling us, in the context of this real-world application.
(e) What is the value of the correlation coefficient, r? Also, interpret its value: Looking at the graph and the size of r, do you judge the strength of the linear relationship to be very strong, moderately strong, somewhat weak, or very weak?