Reference no: EM13677299
(1) USA Today provided a "snapshot" illustrating poll results from 21,944 subjects. The illustration showed that 43% answered "yes" to the following question: "Would you rather have a boring job than no job?" The margin of error was given as ±1 percentage point. Let's assume that the level of confidence was 95%. Describe what is meant by the statement that "the margin of error was given as ±1 percentage point." What confidence interval is USA Today talking about?
(2) You will perform a hypothesis test of H0: μ = 25 on a simple random sample of n = 36. Assume s = 25.
a) If X' = 27, what is the test statistic?
b) What is the p-value if H1: μ > 25?
c) What is the p-value if H1: μ ≠ 25?
(3) In a study designed to test the effectiveness of acupuncture for treating migraine, 95 individuals were treated with acupuncture and 80 individuals were given a sham treatment. The numbers of migraine attacks for the acupuncture treatment group has a mean of 1.8 and a standard deviation of 1.4. The number of migraine attacks for the sham treatment group has a mean of 1.6 and a standard deviation of 1.2
a) Construct the 95% confidence interval estimate of the mean number of migraine attacks for those treated with acupuncture.
b) Construct the 95% confidence interval estimate of the mean number of migraine attacks for those given a sham treatment.
c) Compare the two confidence intervals. What would the results suggest about the effectiveness of acupuncture?
(4) A 95% confidence interval for the difference between tow population means is reported as
0.8 ≤ μ1 - μ2 ≤ 2.3
What could you conclude about the results of a hypothesis test of the null hypothesis that the population means are equal versus the two-sided alternative?
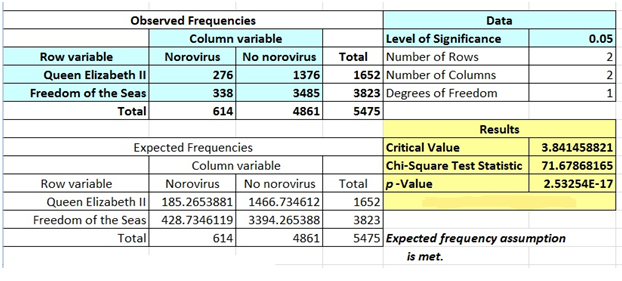
(5) The Queen Elizabeth II cruise ship and Royal Caribbean's Freedom of the Seas cruise ship both experienced outbreaks of norovirus within two months of each other. A study of 5475 passengers reveals the following input and output after performing the test of independence at the 0.05 level of significance.

Based on the printout (some parts of printout were not shown), answer the following:
a) What are the null hypothesis and alternative hypothesis used for the test? Be specific.
H0 (null hypothesis):
H1 (alternative hypothesis):
b) At the 0.05 level of significance, is there evidence of a significant relationship between an outbreak of norovirus and a different effect on different ships?
c) What is your answer to b) if we use the 0.01 level of significance?
(6) A simple random sample of pages from Merriam-Webster's Collegiate Dictionary, 11th edition, is obtained. With the number of words defined in a sample of 11 pages, a sample average is x' = 53.30, and a sample standard deviation is s = 15.6564. Given that this dictionary has 1459 pages with defined words, the claim that there are more than 70,000 defined words is the same as the claim that the mean number of defined words on a page is greater than 48.0. Using a 0.05 significance level, we wish to test the claim that the mean number of defined words on a page is greater than 48.0. A normal probability plot reveals that the population of number of defined words on a page is approximately normally distributed.
a) State the null and alternative hypotheses.
H0 (null hypothesis):
H1 (alternative hypothesis):
b) Select the distribution (Z-distribution or t-distribution) to use. Explain briefly why you selected it.
c) Assuming that they wish to test the claim at a (level of significance) = 0.05, determine the rejection and non-rejection regions based on your hypotheses in a). State the critical value.
d) Calculate the value of the test statistic.
e) Based on the results of c) and d), what do they suggest about the claim that there are more than 70,000 defined words in the dictionary? Explain your conclusion in words.
(7) One classical application of correlation involves the association between the temperature and the number of times a cricket chirps in a minute. Listed below are the numbers of chirps in one minute and the corresponding temperatures in degrees Fahrenheit (based on data from The Song of Insects by George W. Pierce, Harvard University Press).
|
Chirps/min
|
882
|
1188
|
1104
|
864
|
1200
|
1032
|
960
|
900
|
|
Temp (oF)
|
69.7
|
93.3
|
84.3
|
76.3
|
88.6
|
82.6
|
71.6
|
79.6
|
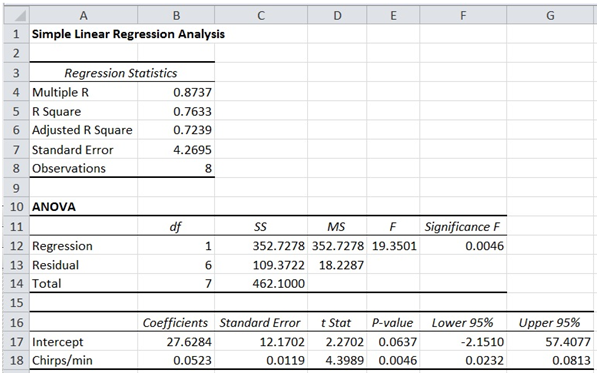
We run regression analysis and obtain the following printouts from Excel. Use them as needed to answer the following questions.
The scatter plot as X = number of chirps per minute and Y = temperature in Fahrenheit.


a) At the 0.05 level of significance, is there evidence of a linear relationship between the number of chirps per minute and the temperature? Make sure to state the null and alternative hypotheses clearly.
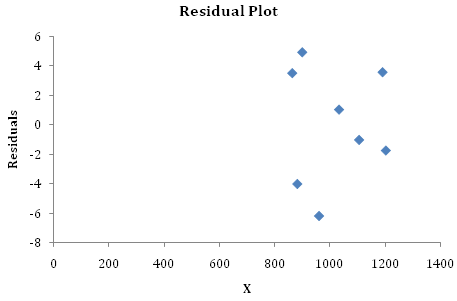
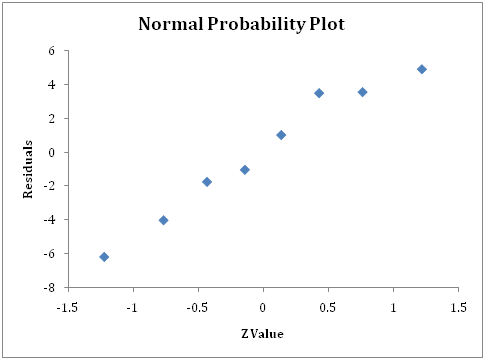
b) Perform the residual analysis (LINE analysis), that is, evaluate whether the assumptions of regression have been seriously violated.
Linearity:
Independence of errors:
Normality of error:
Equal variance:
c) Assuming that all conditions for regression are satisfied (whether or not this is shown in b)), write the regression equation.
d) Test whether b1 (the population slope) is equal to 0 at the 0.05 level of significance. Make sure to state the null and alternative hypotheses clearly.
e) Interpret the meaning of the slope in this model.
f) Interpret the meaning of the intercept in this model. Will this value make sense to the data?
g) Determine the standard error of estimate.
h) Determine the coefficient of determination (r2) and interpret its meaning.
i) Find the best predicted temperature for a time when a cricket is chirping at the rate of 1100 chirps per minutes.
j) Find the total sum of squares SST.