Estimate for gestational age from the sas output

Assignment Help Applied Statistics
Reference no: EM131285498

Focuses on the interpretation of the Pearson correlation and a simple linear regression.

Develop hypotheses, to calculate statistics, and to interpret output and summary tables.

PART ONE: PEARSON CORRELATION

Suppose that we are interested in the strength of the association between dietary sodium intake (the independent variable (X)) and mean diastolic blood pressure (the dependent variable (Y)). We conduct a small pilot study, measuring sodium intake and blood pressure on 15 persons. We calculate a mean dietary sodium of 14.30gm/day and a mean diastolic pressure of 106.53mmHg. The data are displayed in the table below:

Subject X Y X - X-bar (X - X-bar)2 Y - Y-bar Y - Y-bar)2 ( X - X-bar)Y-- Y-bar)
101 10.45 77 -3.85 14.84 -29.53 872.22 113.78
102 7.41 73 _-6.89 47.51 -33.53 1,124.48 231.13
103 15.26 101 _0.96 0.92 -5.53 30.62 -5.3
104 5.2 97 -9.1 82.86 -9.53 90.88 86.78
105 5.4 62 -8.9 79.26 -44.53 1,983.22 396.47
106 5.5 114 -8.8 77.49 7.47 55.75 -65.73
107 22.11 138 7.81 60.95 31.47 990.15 245.67
108 22 144 7.7 59.25 37.47 1,403.75 288.39
109 9 72 -5.3 28.12 -34.53 1,192.55 183.12
110 10.84 104 -3.46 11.99 -2.53 6.42 8.77
111 28 119 13.7 187.62 12.47 155.42 170.76
112 28.9 159 14.6 21.3.08 52.47 2,752.75 765.87
113 21.27 130 6.97 48.54 23.47 550.68 163.5
114 9.4 95 -4.9 24.04 -11.53 133.02 56.54
115 13.8 113 -0.5 0.25 6.47 41.82 -3.25


936.71
11,383.73 2,636.52

From Dawson and Trapp, we know that the formula for the Pearson product moment correlation coefficient is:

r = ∑(X - X¯)(Y - Y¯)/(√∑(Y - Y¯)2

1) Using the information in the table provided, calculate correlation coefficient (r) and show your work.

2) Interpret the size of r in two ways. First, give your interpretation the index value both in terms of direction (positive or negative) and strength (weak, moderate, or strong). Second, give your interpretation if the squared value of r.

We enroll an additional 15 subjects (total sample size = 30) and measure their dietary sodium intake (NA) and mean diastolic blood pressure (DBP). We analyze the data using SAS's CORR procedure and observe the results shown in Table 1 (see page 6). Based on those findings, answer the following questions.

3) Identify the dependent variable and the independent or explanatory variable in this study. Also, state the Null and Alternative hypotheses.

4) Report the correlation coefficient and P-value that should be used to test the Null hypothesis. Based on that information, what conclusion can you make about the Null hypothesis? (i.e. Reject or Fail to Reject the Null). In your response, include your interpretation of the Pearson correlation coefficient.

PART TWO: SIMPLE LINEAR REGRESSION

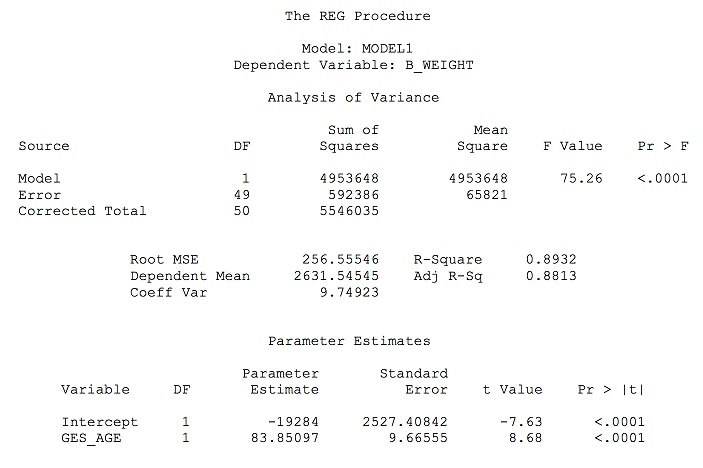
Suppose that we are interested in the relationship between gestational age (in days) and birth weight (in grams). We collect data on gestational age (GES_AGE) and birth weight (B_WEIGHT) for 51 babies and test the null hypotheses that knowing gestational age does not help estimate birth weight. We analyze the data using SAS's REG procedure and observe the results shown in Table 2 (see page 7). Based on those findings, answer the following questions.

1) Identify the dependent variable and the independent or explanatory variable(s) in this study. Also, state the Null and Alternative hypotheses.

2) Report the test statistic and P-value that should be used to test the Omnibus (or Overall) Null hypothesis. What is your conclusion about the Omnibus Null hypothesis?

3) Report and interpret the parameter estimate for gestational age from the SAS output.

4) Using the regression equation (Y = a + bX), calculate the predicted birth weight for an infant born at the gestational age of 280 days.

5) What is your interpretation of the R-square value?

6) Interpret these findings (3-4 sentences max). Your answer should (1) restate the findings, (2) note the generalizability of these results, and (3) state what these findings mean from clinical perspective.

Table 1: Output for Part One

2133_Table.jpg

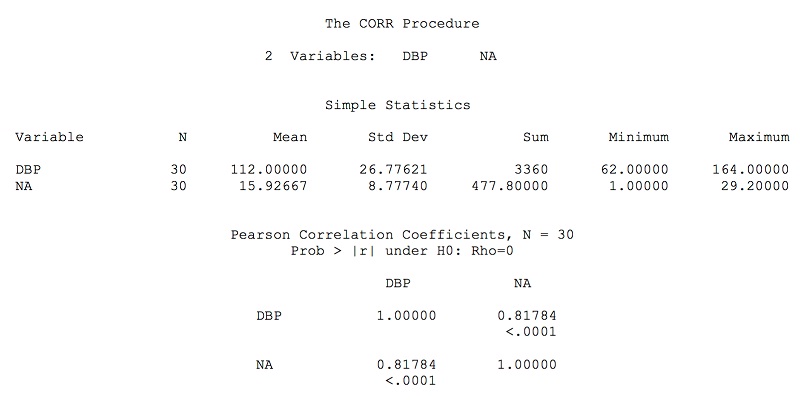
Table 2: Output for Part Two

797_Table1.jpg

Reference no: EM131285498

Questions Cloud

Open systems view of organizations : 1.) Why is the external environment important in the open systems view of organizations? 2.) Select any three management theories (from different approaches). What is the significance of those theories to modern day management practice?
Discuss the role that interest groups play : Discuss the role that interest groups play in explaining and challenging the pluralist claims, views and theories of liberal government. Define revolution, the role that different political actors (including intellectuals) play in it.
Perspectives and specializations : "As a new subject, management has been approached by different theorists from their perspectives and specializations. This resulted in 14 categories of approaches (patterns)." Discuss any three of them.
Should a firm use different criteria in targeting such group : Should a firm use different criteria in targeting such groups? Should the government oversee and control such marketing activities?
Estimate for gestational age from the sas output : Focuses on the interpretation of the Pearson correlation and a simple linear regression - Develop hypotheses, to calculate statistics, and to interpret output and summary tables.
John incremental satisfaction with respect to x : If we limit the range of U(x) between 0 and 1.0, then we can use this function to represent John's utility (i.e. U(x) becomes his utility function). How does his utility function look like? What does U(x) show about John's incremental satisfaction..
Describing the behavior of complex single-degree-of-freedom : Plots of this type can be very helpful in describing the behavior of complex, single-degree-of-freedom systems.
What were the benefits associated with nclb legislation : What is NCLB? What were the benefits and challenges associated with this legislation? What is "Common Core" and what changes did it call for that set it apart from NCLB?
Potential pros and cons to the company and to the customer : What is your personal viewpoint of database-driven positioning strategies? What are the potential pros and cons to the company and to the customer?

Reviews

len1285498

11/22/2016 3:40:56 AM

Focuses on the interpretation of the Pearson correlation and a simple linear regression. Please show your work so I'm able to understand. Thank you.

Write a Review

Applied Statistics Questions & Answers

  Lasso regression and ridge regression

Do a project in data mining with R - statistic and Economics but the project can be not only Economics argument.

  Studio xyz knows that their films made an average

Studio XYZ knows that their films made an average of $45 million on opening weekends from 2003 - 2007. Did Studio XYZ films do better than the industry as a whole? Use your results to decide. HINT - Our initial assumption would be that Studio XYZ mad..

  What is the probability that the last person to board

One hundred people line up to board an airplane. Each has a boarding pass with assigned seat. However, the first person to board has lost his boarding pass and takes a random seat. After that, each person takes the assigned seat if it is unoccupied, ..

  The following data are availableresp nbspnbsp age

the following data are availableresp nbspnbsp age nbspnbspnbsp exam nbsp papernbspnbsp sex nbspnbspnbspnbsp

  Statistics for categorical data-odds ratios and chi-square

To test the hypothesis that there is no association between use of postmenopausal hormones and risk of MI, chi-square statistics need to be calculated.

  Evaluate the correlation coefficient

Evaluate the correlation coefficient.

  Set up the null and alternative hypotheses needed

Letting m represent the mean waiting time under the new system, set up the null and alternative hypotheses needed if we wish to attempt to provide evidence supporting the claim that m is shorter than six minutes.

  The population mean amount owed in student loans

A study of 37 graduates of four-year colleges revealed the mean amount owed by a student in student loans was $16,381. The standard deviation of the sample was $1,352. Construct and explain a 90% confidence interval estimate of the population mean am..

  What is the distribution

Let X~N(2,6) and Y~N(-3,2) and Z~N(0,1). All three random variables are independent of each other. Do the following. a. What is the distribution of W=X+Y+Z? What are E(W) and Var(W)? b. What is the distribution of Q=2Y?

  What percentage of the discount chains female employees have

If 25 percent of the discount chain's employees have a management position, what percentage of the discount chain's female employees have a management position?

  Research question that can be addressed using a t-test

Choose a research question that can be addressed using a t-test. Ensure your research question allows you to collect data to analyze. Devise a plan to collect your data

  Probability that exactly onepassanger arrives late

Airtran's flight #307 can accomodate 50 passengers, but the flight is overbooked,as 52 tickets were sold. Each ticketed passenger can arrive lateand miss the flight with a probability 0.02. What is the probabilitythat no passenger arrives late? What ..

Free Assignment Quote

Assured A++ Grade

Get guaranteed satisfaction & time on delivery in every assignment order you paid with us! We ensure premium quality solution document along with free turntin report!

All rights reserved! Copyrights ©2019-2020 ExpertsMind IT Educational Pvt Ltd