Reference no: EM1378516
Problem 1
The table below gives the annual U.S. demand and supply schedules for pickup trucks.
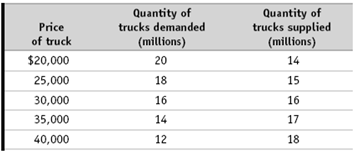
a. Plot the demand and supply curves using these schedules. Indicate the equilibrium price and quantity on your diagram.
b. Suppose the tires used on pickup trucks are found to be defective. What would you expect to happen in the market for pickup trucks? Show this on your diagram.
c. Suppose that the U.S. Department of Transportation imposes costly regulations on manufacturers that cause them to reduce supply by one-third at any given price. Calculate and plot t he new supply schedule and indicate the new equilibrium price and quantity on your diagram.
Problem 2
On Thursday nights, a local restaurant has a pasta special. Ari likes the restaurant's pasta, and his willingness to pay for each serving is shown in the accompanying table.
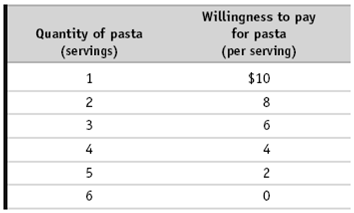
a. If the price of a serving of pasta is $4, how many servings will Ari buy? How much consumer surplus does he receive?
b. The following week, Ari is back at the restaurant again, but now the price of a serving of pasta is $6. By how much does his consumer surplus decrease compared to the previous week?
c. One week later, he goes to the restaurant again. He discovers that the restaurant is offering an "all-you-can-eat" special for $25. How much pasta will Ari eat, and how much consumer surplus does he receive now?
d. Suppose you own the restaurant and Ari is a "typical" customer. What is the highest price you can charge for the "all-you-can-eat" special and still attract customers?
Problem 3
As noted in the text, European governments tend to make greater use of price controls than does the U.S. government. For example, the French government sets minimum starting yearly wages for new hires who have completed le bac, certification roughly equivalent to a high school diploma. The demand schedule for new hires with le bac and the supply schedule for similarly credentialed new job seekers are given in the accompanying table. The price here-given in euros, the currency used in France-is the same as the yearly wage.
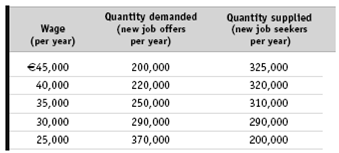
a. In the absence of government interference, what are the equilibrium wage and number of graduates hired per year? Illustrate with a diagram. Will there be anyone seeking a job at the equilibrium wage who is unable to find one-that is, will there be anyone who is involuntarily unemployed?
b. Suppose the French government sets a minimum yearly wage of €35,000. Is there any involuntary unemployment at this wage? If so, how much? Illustrate with a diagram. What if the minimum wage is set at €40,000? Also illustrate with a diagram.
c. Given your answer to part b and the information in the table, what do you think is the relationship between the level of involuntary unemployment and the level of the minimum wage? Who benefits from such a policy? Who loses? What is the missed opportunity here?
|
Explain why would such a system not support evolution
: Explain why would such a system not support evolution by natural selection? For those people that believed in fluid or blending method of heredity must be aware that it does not support evolution by natural selection because it is simply not natur..
|
|
Prioritize and rank values of actions
: The Ulitarian Principle means to select the action with highest value with the assumption we can prioritize and rank prices of actions.
|
|
Elucidate how man is constructing his world
: So difference but God and man is him mortality, and limitation of creativity. One example of this is their newfound nakedness.
|
|
Traditional medicine philosophy
: Do you think that insurance Corporation should cover alternative or complementary medicine? If so, should the coverage be the same as traditional?
|
|
Equilibrium price and quantity
: Calculate and plot t he new supply schedule and indicate the new equilibrium price and quantity on your diagram
|
|
Evaluate the overall risk to the organization
: Estimate the overall risk to the organization if the value of uninsured and underinsured continue to rise at 2 or 3 percent over the next five years.
|
|
Question about training
: Jim Delaney, president of Apex Door, has a problem. No matter how often he tells his workers how to do their jobs, they invariably decide to do it their own way,
|
|
Maiximum number of six letter words
: An anthropologist finds an isolated tribe whose written alphabet contains only 6-letters. The tribe has a taboo against using the same letter twice in same word.
|
|
Question about technology management
: WENDY'S is an excellent example of an organization that has displayed environmental adaptability.
|