Reference no: EM132558641
ENGG 0010 Control and Instrumentation - Middle East College
Learning Outcome 1: Propose appropriate signal conditioning systems and evaluate the limitations of measurement systems and appraise the use of smart measurement systems and data acquisition parameters.
Learning Outcome 2: Employ computer tools in system modelling and design, e.g MATLAB, Simulink
Assignment Objective
This will enable each student evaluate, analyze and design control and instrumentation employing computer tools or online application e.g. Octave. This assessment will develop student's analytical and critical thinking and problem solving skills.
Question 1:
To limit the operating bandwidth of a transmission cable used in the instrumentation systems, a band pass filter with high roll-off rate is needed. Using the filter configuration given in figure 1, design a 2nd order Chebyshev (3dB) band-pass filter with a 3-dB frequencies of ωL = 450 rad/s and ωH = 900K rad/s . Also draw the final circuit diagram with component values. Use C=10nF and Sallen-Key correction factors same for LPF and HPF. Different filter type and frequency values for different sets.
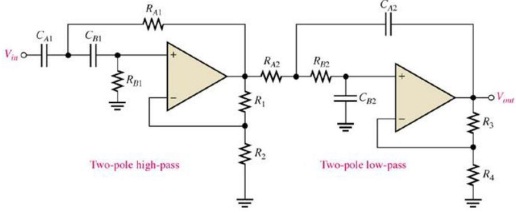
Figure 1
Question 2:
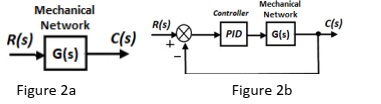
Given a car transmission system mechanical network in figure 2a with G(s) = 20/s2 +12s+30 using Octave/Matlab software, perform the following.
a. Write a script and obtain the transient time and steady state responses values from the step response and impulse response graphs
b. To improve the performance of the system, cascade a PID as shown in figure 2b with the following parameter Kp=11, Ki=33, Kd=0.95. Write a script to generate the transient time response graph and obtain the transient time values from the step response graph of this compensated system.
c. Generate the step responses of the original network and the enhanced network on a single graph and compare the responses.
Question 3:
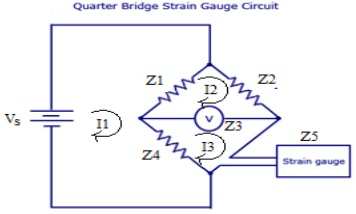
Strain Gauge is a passive transducer that converts a mechanical elongation or displacement produced due to a force into its corresponding change in resistance R. The strain Gauge is connect to a Wheatstone Bridge that serves as the signal processor, and the Voltmeter that serves as the display as shown in figure 3. The supply voltage Vs=14V. Do the following.
a. Write an Octave/Matlab script that will generate the reading of the voltmeter as the strain gauge value is varied from (Z-1) to (Z+1) with increment of 0.1 Ω, Z1 = Z2 = Z4 = Z = 1000Ω and Z3 = 1MΩ.
b. Using octave/Matlab commands, generate a graph having the x-axis as the different values of the strain gauge resistance, and y-axis as the output voltage of the voltmeter corresponding to this resistance changes.
c. Comment on the input-output relationship of the graph
Question 4:
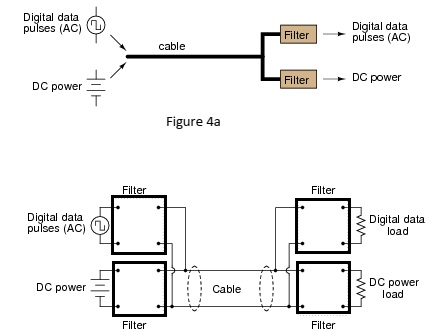
a. Filter circuits are also necessary on the transmission end of the cable, to prevent the AC signals from being shunted by the DC power supply's capacitors, and to prevent the DC voltage from damaging the sensitive circuitry generating the AC voltage pulses as shown in figure 4a. Draw some filter circuits on each end of this two-wire cable as shown in figure 4b that perform these tasks, of separating the two sources from each other, and also separating the two signals (DC and AC) from each other at the receiving end so they may be directed to different loads:
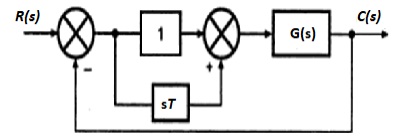
b. A Proportional plus Derivative (PD) system is given in figure 4c with G(s) = 28/s(s+1.3) Calculate the derivative time constant T so that the system will have a damping ratio of ζ=0.5. Also, calculate the settling time.
Question 5:
a. Signal conditioning circuits are used to process the output signal from a sensor of a measurement system to be suitable for the next stage of operation. Discuss any four of these processes.
b. To eliminate short term fluctuation of signals and provide smoother form of signal, low pass filters are use. Using a passive low pass RC filer having R= 50Ω, and C=4mF, draw the frequency response graph using a range of frequencies from ωL = 0.01rad/s to ωH = 1000 rad/s.