Elements in deriving a labor demand curve

Assignment Help Business Economics
Reference no: EM13847539

1. The table below describes the key elements in deriving a labor demand curve for a bakery. Complete the table and answer the following questions. Capital (K) is fixed at 1 unit.

Number of Workers

Number of Loaves Baked per hour

MP of Labor

Price per loaf

P x MP

Nominal Wage Rate (W)

Real Wage Rate (W/P)

0

0

--

$1

--

$8

$8

1

20

20

$1

$20

$8

$

2

36


$1


3

48


$1


4

56


$1


5

60


$1


6

62


$1


a. At what employment level does the firm encounter diminishing marginal returns?

b. Draw a graph of the MP of labor column. Plot the number of workers on the horizontal axis and dollars on the vertical axis. What does this curve represent?

c. How many workers will the bakery hire if the nominal wage rate is $8?

d. Suppose the price of bread increased to $2 per loaf. How many workers will the bakery hire if the nominal wage rate is $8?

2. Assume that the production function is given by Y = A K .4 L .6 where Y = National Income =GDP, K = 100, L= 400, and A = 10.

a. Calculate National Income (Y)?

b. Derive the equation for the marginal product of labor (MPL)

c. What happens to the MPL as K increases?

d. Derive the equation for the marginal product of capital (MPK)

e. What happens to the MPK as K increases?

3.In December 2005, the BLS estimated there were 7.4 million unemployed, 142.8 million employed (including 2.8 million involuntary part-time workers), 451,000 discouraged workers and 4.8 million people (including discouraged workers) who were marginally attached to the labor force.

a. Calculate the headline (U-3) unemployment rate for December 2005.

b. Calculate the unemployment rate for December 2005 if it had included among the unemployed all officially discouraged workers.

c. Calculate the unemployment rate if it had included all those who were marginally attached to the labor force?

d. Calculate the unemployment rate if it had included all those who were marginally attached to the labor force plus involuntary part-time workers.

4. Fred Data Exercise - You must do the data exercise in order to receive credit for questions 1 through 3 above.

Unemployment

1. Go to the FRED website. In the search box type in "civilian unemployment rate. Click on "seasonally adjusted." This is the U-3 measure of unemployment. Not surprisingly, unemployment increases during recessions. Based on the graph (no need to print), how high did unemployment get in the 1981 recession? How about the last recession?

2. In the search box type in "Civilian Labor Force Participation Rate". Next click on "Civilian Labor Force Participation Rate". Graph "seasonally adjusted". Define the Labor Force Participation Rate (LFPR) and describe the overall pattern from 1960 through 2015.

3. The graph starts in 1950. Use the slider under the graph to start the graph in 1990. Why do you think the LFPR has been declining since 2000?

4. Click on "Add Series". Search for Civilian Labor Force Participation Rate: 25 to 54 years. Add series. Now click on "edit series for 25 to 54 and click "right" for Y-Axis position. Print the graph.

5. How would you respond to the argument that the LFPR is declining because "babyboomers" are retiring.

6. The Labor Force Participation Rate (LFPR) in January 2008 was 66.23%. In June 2015 the LFPR had decreased to 62.65%, the unemployment rate was 5.3%, the adult population was 250,663 (thousand) and the number of people employed was 148,738(thousand). Determine the unemployment rate in June 2015 if the LFPR had remained at 66.23%. Show your work.

7. Go to the BLS website https://www.bls.gov/news.release/empsit.nr0.htm

Find the Employment situation Report for August 2015.

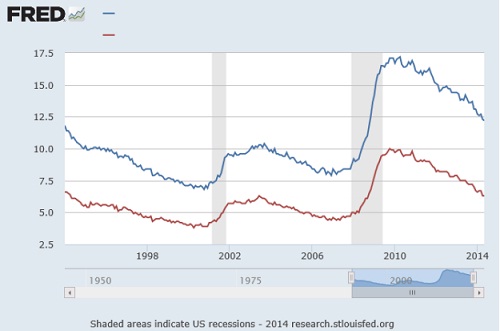
Go to Table A-15: Alternative measures of labor underutilization. For August 2015, what were the U-4, U5 and U-6 measures of unemployment.

1.
1979_FRED Data.jpg

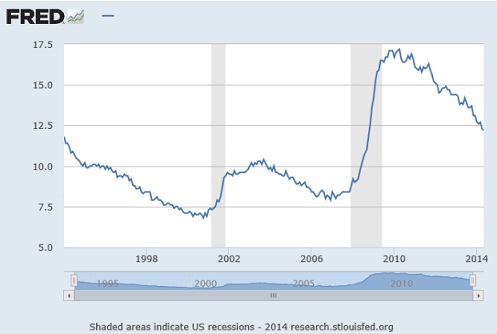
2.

1182_FRED Data 2.jpg

8. Go to the Federal Reserve Economic Data (FRED) web site: https://research.stlouisfed.org/fred2/

In the search box in the upper right hand corner, type in "Quits". Next click on "Quits: Total Nonfarm".

Copy/Paste the graph in the space below:

What are "quits".

What happens to "quits" during recessions?

9. In the search box in the upper right hand corner, type in "layoffs". Next click on "Layoffs and Discharges: Total Nonfarm".

Copy/Paste the graph in the space below:

What happens to "Layoffs and discharges" during recessions?

10. In the search box in the upper right hand corner, type in "hires". Next click on "Hires: Total Nonfarm".

Copy/Paste the graph in the space below:

What happens to ""hires" during recessions?

Reference no: EM13847539

Questions Cloud

What coupon rate should the company set : Wyland Co. wants to issue new 20-year bonds for some much-needed expansion projects. The company currently has 7 percent coupon bonds on the market that sell for $1,085, make semiannual payments, and mature in 20 years. What coupon rate should the co..
Determine central sales tax payable : Determine CST payable assuming that all transactions were covered by valid ‘C' forms and the VAT rate within the State is 5%.
The bonds make semi annual payments : Watters Umbrella Corp. issued 20-year bonds 2 years ago at a coupon rate of 8.6 percent. The bonds make semi annual payments. If these bonds currently sell for 107 percent of par value, what is the YTM?
What will your loan balance be at the end of year : You have purchased a home for $150,000 and are making a 10% down payment. What is your monthly payment if the interest rate is 4% and the term is 30 years? What will your loan balance be at the end of year 10? Write your numerical answers in the spac..
Elements in deriving a labor demand curve : 1. The table below describes the key elements in deriving a labor demand curve for a bakery. Complete the table and answer the following questions. Capital (K) is fixed at 1 unit.
Estimated that the annual sales of energy saving device : It is estimated that the annual sales of an energy saving device will be 25,000 the first year and increase by 10,000 per year until 55,000 units are sold during the fourth year. Proposal A is to purchase manufacturing equipment costing $125,000 with..
Investment goal : You would like to have $44,073 for the down payment on a house you plan to buy five years after you graduate. If your investments earn 1.2% APR compounded monthly, how much do you have to invest each month, starting next month, to meet your investmen..
How do individuals acquire and develop language : How do individuals acquire and develop language? How do you personally communicate your thoughts and how did you learn to do so? Based on your own experiences, what are some symbols (e.g., letters of the alphabet) people use to communicate
What is money measurement concept : What are accounting concepts? What is money measurement concept? Explain concept of continuity? Why cost concept is also known as historical cost concept?

Reviews

Write a Review

Business Economics Questions & Answers

  Economics assignment

This document contains various important questions and their appropriate answers in the subject field of Economics.

  Demand and supply curves

Economics is the study of the principles governing the allocation of scarce means among competing ends when the objective of the allocation is to maximize the attainment of the ends.

  Long-run perfectly competitive equilibrium for the firm

Evaluate Government intervene and correct this situation?(a) Explain the concept of a concentration ratio. A rise in the price of magarine Explain the impact of external costs and external benefits on resource allocation long-run perfectly c..

  Supply and demand diagrams

Explain each of the following using supply and demand diagrams,  With the use of a graph, explain how these two programs affect cigarette consumption and the price of cigarettes.

  Case study: fisher-price toys

The case study of the Fisher-Price Toys, Inc., a popular case in basic economics and management from the prestigious Harvard Business School.

  Draw the production possibility curve

Draw the production possibility curve and a. Define consumer surplus and producer surplus.

  Tax revenue

The Australian government administers two programs that affect the market for cigarettes

  Maximize total welfare

How many tickets to sell to maximize total welfare.

  Difference between the cv and the ev

The change in consumer surplus (?CS) is not "theoretically" justifiable like the CV and EV but it continues to be the most widely used measure of consumer welfare change. Explain how this can be reconciled

  Depict von neumann-morgenstern utility index u in a diagram

Depict the von Neumann-Morgenstern utility index u in a diagram

  What is the market solution

What is the market solution (market price and quantity) and What is the total surplus of the society under the market solution

  Calculate gross national product and net national product

Calculate gross national product and net national product

Free Assignment Quote

Assured A++ Grade

Get guaranteed satisfaction & time on delivery in every assignment order you paid with us! We ensure premium quality solution document along with free turntin report!

All rights reserved! Copyrights ©2019-2020 ExpertsMind IT Educational Pvt Ltd