Reference no: EM132501190
ECON3034 Financial Econometrics - Macquarie University
Learning Outcome 1: Apply econometric methods to modelling, analysing and forecasting financial data
Learning Outcome 2: Critically evaluate empirical econometric work.
Learning Outcome 3: Present results based on financial econometric analysis, to a non-technical audience, in a clear and understandable manner.
Part 1
The EViews work file "Assignment_S12020_Workfile.wf1" located under "Assessment" heading on iLearn contains six monthly return series for the period January 1980 - February 2020 (482 observations). (Note: Please see the document ‘How to save images from AppStream' on our iLearn site under Assessment in order to obtain an image of a table or graph in EViews.)
The following monthly return series appear in the file:
A. The excess return on a portfolio of two industry stocks from Fama and French.
• hitec _ rf (Average monthly excess return on a portfolio of high tech stocks. The high tech stocks are listed on U.S. exchanges and the return is in excess of the U.S. risk free rate).
• manuf _ rf (Average monthly excess return on a portfolio of manufacturing stocks. The manufacturing stocks are listed on U.S. exchanges and the return is in excess of the U.S. risk free rate).
B. Returns on four pricing factors from Fama and French.
• mkt _ rf (Excess return on a weighted portfolio of all stocks in the U.S. market. It is the U.S. Market Risk Premium).
• hml (Average monthly return on a portfolio of High Book-to-Market (Value)
stocks less the average monthly return on a portfolio of Low Book-to-Market (Growth) stocks).
• smb (Average monthly return on a portfolio of small capitalization stocks less the average monthly return on a portfolio of large (big) capitalization stocks).
• cma (Average monthly return on a portfolio of stocks for firms which invest conservatively less the average monthly return on a portfolio of stocks for firms which invest aggressively. This is known as the Fama and French investment factor).
Note: All of the returns are expressed in percent, e.g. 2.65% is represented by 2.65, not by 0.0265.
Answer the following questions based on this dataset:
Question 1. Estimate the following regression for the excess return on the portfolio of high tech stocks for the full sample 1980m01 to 2020m02 and include a table of results from EViews.

Are the estimated coefficients on the factors statistically significant at the 5% level?
Question 2. In general, what is the expected sign on each of the factors? (Hint: To read about the factors, hml and smb, search under Fama-French three factor model and to read about cma , search under Fama-French five factor model.) Provide a plausible reason for the sign of the estimated coefficient on each factor you found in the regression for hitec _ rf . (Hint: What do you think are the typical characteristics of high tech companies?)
Question 3. Estimate the following regression for the excess return on the portfolio of manufacturing stocks for the full sample 1980M01 to 2020M02 and include a table of results from EViews.
Are the estimated coefficients on the factors statistically significant at the 5% level?
Question 4. Compare the signs on the estimated coefficients on the factors in both regressions (i.e. for high tech and manufacturing portfolio regressions) . What does this comparison suggest about the financial characteristics of manufacturing and high tech companies?
Question 5. Is the estimate of β1 statistically significant at the 5% level in each of the regressions? How do you interpret this result?
Question 6. Perform White's test (with no cross product terms) for heteroscedasticity in the estimated residuals from each regression. (Write out the null and alternative hypotheses of the test, explain and provide the EViews output showing the results, and clearly state the conclusion of the test. Use a 5% significance level).
Question 7. In view of the results of White's test, should you be concerned about heteroscedasticity and if so, what should you do, and would that change any of the conclusions you reached in earlier questions.
Part 2
The EViews work file "Assignment_S12020_Workfile.wf1" contains data on the U.S. term spread. This series is shown as spread in the work file. The spread is defined as the yield on 10-year U.S. Treasury Bonds less the yield on 3-month U.S. Treasury Bills, expressed in percent per year, e.g. 1.60% is represented by 1.60, not by 0.0160. The data is obtained from the FRED database of the Federal Reserve Bank of St Louis at the monthly frequency. The data is for the period January 1980 - February 2020 (482 observations).
Question 8. Using EViews, plot the term spread with a line chart and draw a horizontal line at value zero on the graph. Identify the episodes in the graph when the term spread is negative. What was about to happen to the U.S. economy soon after these episodes?
(Hint: Click on the series ‘spread' and the data appears. Choose View, then Graph and for graph type: select Basic and for specific: select Line and Symbol. Click O.K. and the graph appears without the horizontal line. ‘Freeze' the graph by clicking on Freeze and then O.K. The ‘frozen' graph comes up. Right click anywhere in the frozen graph and you will see a list of options. Select ‘Add lines and Shading'. Then for Type, select line and for Orientation, select Horizontal-left axis, and for Data Value under Position, type in 0. You will now have the horizontal axis shown in your graph).
Question 9. Conduct an ADF unit-root test on the ‘spread' series. Be careful to properly state the null and alternative hypothesis for the test. Also conduct a KPSS unit root test and be sure to state the null and alternative hypothesis for the test. Are the results from both tests consistent with each other?
Question 10. Compute the ACF and PACF for ‘spread' for the first twelve lags using EViews. Comment on the pattern of the ACF and PACF and what they may say about the time series process for ‘spread'.
Question 11. Consider the three models where yt
denotes the spread:
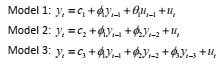
Estimate each model in EViews, comment of the significance of the coefficients (apart from the constant) and select the best model using the Akaike Information Criteria (AIC) and the Schwarz Bayesian Information criteria (SBIC).
Hint: Sample sizes need to be the same when comparing models with AIC or SBIC. That is, estimate the models over the sample period 1980m04 to 2020m02 (i.e. beginning in December 1980). In the equation estimation box, change 1980m01 to 1980m04).
Question 12. Using EViews, compute the ACF and PACF (the first 12 lags) of the residuals of the preferred model, estimated from the sample running from 1980m04 to 2020m02. Comment on the results.
Question 13. Estimate Model 1 for the sample 1980m04 to 2017m12 and generate a dynamic forecast for the period 2018m01 to 2020m02. (Hint: First estimate Model 1 being sure to specify 1980m04 2017m12 in the estimation settings box. Having estimated the model, select the forecast tab, select dynamic forecast, set the forecast sample to 2018m01 to 2020m12, and in the forecast name box, type spreadf which saves the dynamic forecasts on the workfile under this series name).
(i) Explain what is meant by a dynamic forecast.
(ii) EViews generates a graph for the dynamic forecasts you generated together with the two-standard error band. Present this graph and comment on the convergence or otherwise of the forecast values and on the behaviour of the two-standard error band. (3 marks)
(iii) Graph the actual spread series and the dynamic forecast of the spread series
i.e. spreadf on the same graph for the period 2018m01 to 2020m02. Comment on the graph. (Hint: Click on Quick/Sample and change the sample to 2018m01 2020m02. Then click on Object/New Object/Group and OK. In the list of series box, type spread and spreadf and click OK. Then click on View/Graph to graph both series together).