Reference no: EM132616446
ECON11026 Principles of Economics - Central Queensland University
Question 1. Market Structures: Chapter 7 Perfect Competition
Refer to solved problem 7.1 in this chapter for understanding the calculations. Assume that Angela sells hot dogs in a perfectly competitive hot dog market. Her output per day and costs are outlined in the following Table-1.
Table 1
|
Output per day
|
$ Total cost (TC)
|
$ ATC
|
$ AVC
|
Marginal
cost (MC) $
|
Marginal
Revenue (MR) $
|
|
0
|
$1.00
|
--
|
--
|
--
|
--
|
|
1
|
2.50
|
|
|
|
|
|
2
|
3.50
|
|
|
|
|
|
3
|
4.20
|
|
|
|
|
|
4
|
4.50
|
|
|
|
|
|
5
|
5.20
|
|
|
|
|
|
6
|
6.80
|
|
|
|
|
|
7
|
8.70
|
|
|
|
|
|
8
|
10.70
|
|
|
|
|
|
9
|
13.00
|
|
|
|
|
(a) Complete Table-1 columns for Average Total Cost (ATC), Average Variable Cost (AVC), MC and MR. List and explain the assumptions of perfect competition for hot dog market.
(b) If the current equilibrium price in the hot dog market is $1.80, how many hot dogs will Angela produce, what price will she charge and how much profit (or loss) will she make?
(c) Draw and explain the graph to illustrate your answer. Your graph should be clearly labelled and should include Angela's ATC, AVC, MC and MR demand curves, the price she is charging, the quantity she is producing and the area representing her profit (or loss). (2.5 marks)
Question 2. Market Structures: Chapter 8 Monopoly
(a) This question is related to solved problem 8.1 in the textbook. Don has acquired a monopoly in the production of cricket balls and faces the demand and cost situation shown in the following Table-2.
Table 2
|
Price
|
Quantity Per week
|
Total Revenue
|
Marginal Revenue
|
Total Cost
|
Marginal Cost
|
|
$20
|
15,000
|
|
|
$330,000
|
|
|
19
|
20,000
|
|
|
365,000
|
|
|
18
|
25,000
|
|
|
405,000
|
|
|
17
|
30,000
|
|
|
450,000
|
|
|
16
|
35,000
|
|
|
500,000
|
|
|
15
|
40,000
|
|
|
555,000
|
|
(i) Complete TR, MC and MC columns in Table-2.
(ii) List and explain briefly the assumptions under which Don's monopoly for cricket ball firm operates.
(iii) If Don wants to maximise profits what price should he charge and how many cricket balls should he sell? How much profit will he make?
(iv) Suppose the government imposes a tax of $50,000 per week on cricket ball production. Now what price should Don charge, how many cricket balls should he sell and what will his profits be?
Question 3. Market Structures: Chapter 9 Monopolistic Competition
(a) Explain the similarities and differences between the long-run equilibrium for a:
(i) perfectly competitive firm, and a (ii) monopolistically competitive firm with examples. Illustrate your answer with a graph demonstrating the long-run equilibrium for the two types of firms.
(b) Assume that two interior design companies Baine and Alistair are competing for customers, and if they both advertise, they would each earn $30 million in profits. If neither advertises, they each earn $50 million in profits. If one advertises and the other doesn't, the firm that advertises earns $40 million in profit while the other earns $20 million in profit.
(i) Present the information above in the form of a payoff matrix. Let Baine be the row player and Alistair the column player.
(ii) Does each firm have a dominant strategy and if so, what is it?
(iii) Define and explain the Nash Equilibrium in this example.
Question 4. Market Failure and Externalities: Chapter 11
Figure-1 shows example of a market for COVID-19 vaccinations, a product whose production as well as consumption generates positive externalities on the global population, society and individuals. Study Figure - 1 to answer the following questions.
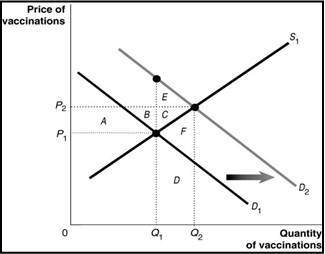
Figure 1
(a) Given the current global pandemic and its impact, define and explain positive production and positive consumption externalities in context of COVID-19 vaccination.
(b) What does the curve D1 represent in Figure-1?
(c) What is the economically efficient output level in Figure-1?
(d) What does the curve D2 represent in Figure-1?
(e) What is the market equilibrium output level in Figure-1? Explain.
(f) Define dead weight loss. Which area represents the deadweight loss resulting from producing at the market equilibrium?
(g) Why is there a deadweight loss?
Attachment:- Principles of Economics.rar