Reference no: EM132528558
ECO306 Business Microeconomics
Assignment 1
Problem 1
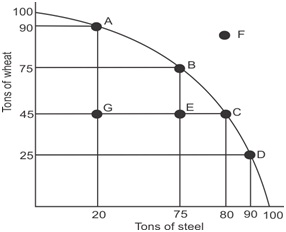
A country has resources to produce 100 tons of wheat or 100 tons of steel that shows in the below diagram.

Required
a) Calculate the opportunity cost from Point A to Point B.
b) Calculate the opportunity cost from Point B to Point C.
c) What conclusion can you make from Part a and Part b?
d) What are the factors of production? How does it relate to Points E and G.
Problem 2
Below is the market demand and supply schedule for wheat (tonnes per year).

Required
a) Plot and label the demand curve (D) for wheat and its supply curve (S).
b) Imagine now that supply falls by 200,000 tonnes at each and every price. Draw and label the new supply curve (S1)
c) What is the new market price and the new quantity traded? Show these on the graph.
d) Suggest three reasons why the supply of wheat may fall?
Problem 3
In City A, there are many factories producing tobacco and this cause people to smoke more than expected. The community realize that it is kind of overproduction of tobacco, and should be controlled.
Required
a) What is market failure? What type of externality of this example?
b) Draw an appropriate diagram to present the above situation with full labels.
c) Provide a method to solve this externality.
Problem 4
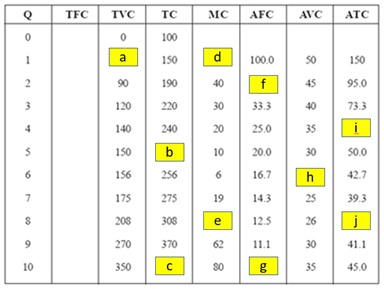
Use the following cost of production table to answer questions

Required
a) How much of total fixed cost (TFC)?
b) Fill in the blanks.
c) What is this market structure? Assume that the price of product is $62 per unit, what is the maximum profit output? How much does it make? Provide a detail calculation process is needed.
Assignment 2
Problem 1
A firm provides the following cost of production schedule. The market price of the product is $60 per unit.

Required
a) Complete the above table.
b) If the firm aims to achieve the maximum profit, what output level should it produce?
c) Calculate its maximum profit.
d) Explain what type of market does this firm operates at?
Problem 2
In a free market, the equations of demand curve is: P = 50 - 2Q and the supply curve is P = 10 + 2Q.
Required
a) Calculate the equilibrium price and quantity.
b) Draw an appropriate diagram to present the result from part a with full labels.
c) Explain what would happen to the new equilibrium if the labor cost increases significantly.
Problem 3
A fast food restaurant manager is thinking to decrease lunch set price from $45 to $40 and expects the quantity will increase from 250 sets to 300 sets per day.
Required
a) Calculate the price elasticity of demand, and make a conclusion. Take 2 decimal places.
b) Will this fast food restaurant be better off or worse off after cutting lunch set price down? Explain.
c) Provide 3 determinants of the price elasticity of demand.
Problem 4
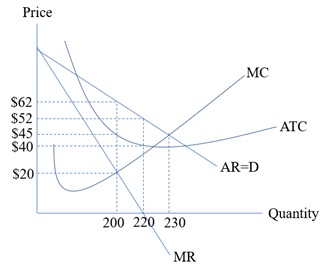
Using the following diagram to answer the question.

Required
a) What is this market?
b) What are characteristics of this market?
c) What is the difference between maximum profit and maximum revenue? What are their output levels?
d) Calculate the maximum profit and maximum revenue.
Problem 5
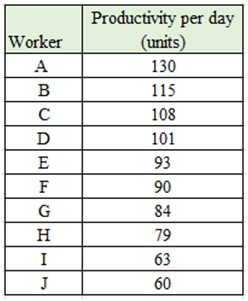
A small factory plans to hire 10 workers to produce a product. The product will sell to the local retail stores at $6 per unit. These workers' daily productivitiesare shown as below. The daily wage for each worker is $500.
Required
a) Calculate MRP for each worker.
b) Determine and explain how many workers should be hired?
c) If the wage increases by$50, how many workers should be hired?
d) Explain the backward-bending labor supply curve.
