Reference no: EM132554420
You have the following data and graphs depicting the state of the UAE economy.
Answer all questions
Question 1
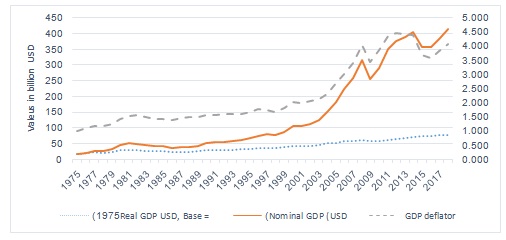
The following two figures, Figure 1 and Figure 3, plotNominal GDP and real GDP (on the left side), and GDP deflator (can be used as Price Index) on the right side, for the UAE economy in billions of USD from 1975 to 2018.
Figure 1: Trends in GDP and components from 1975 to 2018 in billions of USD
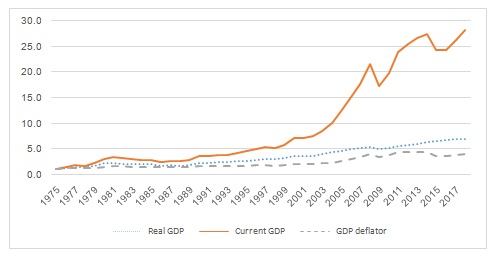
In Figure 2, we convert USD data in Figure 1 into the form of INDICES to allow for better reading of trend
Figure 2: Indices of real GDP, nominal GDP and Real GDP for the UAE economy from 1975-2018
A. Comment on the trends in nominal GDP and real GDP
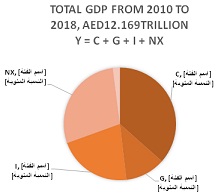
B. In Figure 3, shows the structure of the UAE economy following the spending approach, using data covering the whole period from 2010 to 2018. Data are obtained from Federal Competitiveness and Statistics Authority
Following Figure 3, give the TWO characteristics of the UAE Economy following the spending approach.
Question 2
Table 1 presents Unemployment Rates by Age Group in UAE, 2017
Table 1: Unemployment Rate by Age Group in UAE, 2017
|
Age category
|
Emirati and non-Emirati
|
|
Male
|
Female
|
Total
|
|
|
15-19
|
26.6%
|
21.6%
|
25.4%
|
|
|
20-24
|
4.4%
|
12.5%
|
6.2%
|
|
|
25-29
|
1.5%
|
8.5%
|
3.1%
|
|
|
30-34
|
0.7%
|
6.4%
|
1.9%
|
|
|
35-39
|
0.8%
|
5.6%
|
1.8%
|
|
|
40-44
|
0.7%
|
3.9%
|
1.3%
|
|
|
45-49
|
0.8%
|
4.1%
|
1.3%
|
|
|
50-54
|
1.3%
|
3.2%
|
1.5%
|
|
|
55-59
|
0.7%
|
1.7%
|
0.8%
|
|
|
60-64
|
1.2%
|
0.0%
|
1.1%
|
|
|
+65
|
1.1%
|
0.0%
|
1.0%
|
|
|
Total
|
1.4%
|
6.8%
|
1.7
|
|
|
Total population
|
6,415,942
|
2,888,335
|
9,304,277
|
|
From Table 1, identify two major of unemployment characteristics in the UAE
Question 3
Let assume that the share of the working population in the population is 78%, and let's assume that GDP per capita is AED 150,000 (as annual average for the period 2010-2018), calculate and comment on the value of productivity of labour.
|
|
Population
|
Nominal GDP (millions ofAED)
|
Nominal GDP per capita (AED)
|
|
2010
|
8,264,070
|
1,064,244
|
128,780
|
|
2011
|
8,672,000
|
1,287,821
|
148,503
|
|
2012
|
8,900,000
|
1,375,684
|
154,571
|
|
2013
|
9,006,000
|
1,432,670
|
159,079
|
|
2014
|
9,071,000
|
1,480,521
|
163,215
|
|
2015
|
9,104,000
|
1,315,251
|
144,470
|
|
2016
|
9,121,000
|
1,311,248
|
143,761
|
|
2017
|
9,304,000
|
1,387,107
|
149,087
|
|
2018*
|
9,304,000
|
1,521,072
|
163,486
|
|
Total period 2010-2018
|
80,746,070
|
12,175,618
|
150,789
|
Question 4
A. Figure 4shows monetary aggregates data related to UAE economy between 2013 and 2018.
Figure 4: UAE Monetary Aggregates End of Month, Figures in billions of Dirhams)
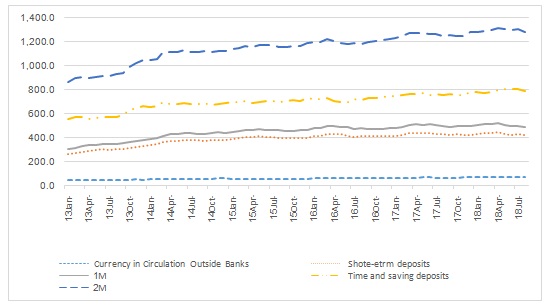
Figure 4 shows monetary aggregates data related to UAE economy between 2013 and 2018.
A. Looking at the graph, what is the largest component of money supply M2?
B. Figure 5 shows the trend in GDP deflator between 1975 and 2018. GDP deflator can be used as a proxy of inflation
In Figure 5, identify THREE time periods of deflation and ONE time periods of high inflation
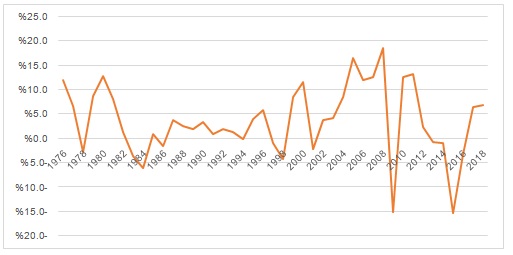
C. What is the cause of inflation according to the quantity of money equation, MV = PY?
Question 5
Table 2 shows nominal GDP and Money supply M2 of the UAE economy between 2013 and 2018 as reported.
Table 2: GDP, and M2 of UAE from 2013 to 2018
|
|
2013
|
2014
|
2015
|
2016
|
2017
|
2018
|
|
GPD
|
1,432,670
|
1,480,521
|
1,315,251
|
1,311,248
|
1,387,107
|
1,521,072
|
|
M2*
|
1,043.0
|
1,125.4
|
1,186.8
|
1,225.5
|
1,276.2
|
1,308.5
|
A. Calculate Velocity (V2013) in 2013
B. Calculate Velocity (V2018) in 2018
C. Did velocity increase or decrease and give ONE possible justification for this increase of decrease?
Question 6
Figure 6 plots Price of Brent Oil 1987 and 2019
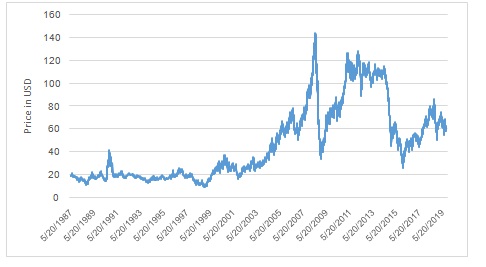
Figure 7 plots important macroeconomic indicator "real GDP growth rate" for the UAE economy between 1975 and 2018
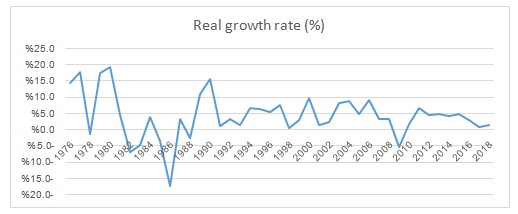
A. From graph Figure 6 and Figure 7, identify two periods where GDP growth rate become negative and give possible reasons for this decline
1. Period 1:
Reason:
2. Period 2:
Reason:
B. From graph Figure 6 and Figure 7, identify two periods where GDP growth rate become positive and give possible reasons for this increase
3. Period 1:
Reason:
4. Period 2:
Reason:
Question 7
A. From your answers in A and B, what do you conclude of the relationship between GDP growth rate and Oil prices?
B. Give 2 policy measures as suggestion to CUT dependence of growth on oil
Measure 1:
Measure 2:
Question 8
A. What is monetary policy?
B. In 2018, the average R was 14%. Calculate the money multiplier for 2018
C. If the government wants to reduce inflation rate to 2% and keep 5% real GDP growth rate, use "the exchange equation" to calculate the money growth rate.(2 marks)
D. Using the required Reserves ratio, R, as a monetary policy tool, explain how to absorb inflation in the UAE, and say whether you recommend increasing or reducing the R.
Question 9
Figure 8 shows trends in TWO importance economic indicators between 2001 and 2018: Consumer spending in thousands of AED and nominal GDP in thousands of AED.
Figure 8: Consumer spending and nominal GDP (GDP at market price) in thousands of AED
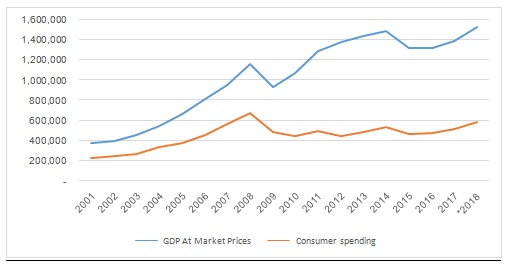
A. From Figure 8, comment in the trends and relationship between nominal GDP as income and consumer spending
B. Figure 9 shows the (linear) consumption function of the UAE economy using data from 2001 to 2018. The consumption functions represent the heart of the Keynesian theory of macroeconomics.
The function can be represented as C = 229,665 + 0.2184 Y
Figure 9: The consumption function of the UAE economy Y is current GDP (values are in 1000s AED)
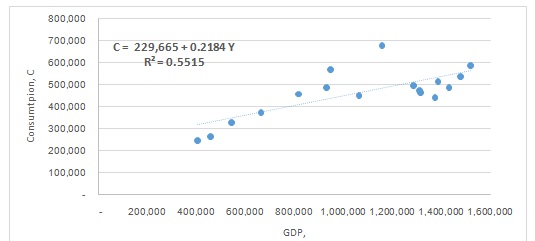
i. Interpret AED 229,665
ii. Interpret 0.2184 Y
iii. If someone's income Y is AED240,000 per year, how much total consumer spending?
iv. If someone's income Y increases by 10% and becomes, 264,000 per year, how much the new increase in consumer spending?(2 marks)
Question 10
Table 3 shows data related to fiscal behaviour of the UAE government.
|
Item
|
Oil revenues
|
Other revenues
|
Total Revenues (T)
|
Total spending (G)
|
Surplus Or Deficit
|
|
2010
|
169,780
|
112,242
|
282,022
|
344,036
|
-62,014
|
|
2011
|
262,436
|
117,429
|
379,865
|
451,871
|
-72,006
|
|
2012
|
279,276
|
133,446
|
412,722
|
479,349
|
-66,627
|
|
2013
|
293,245
|
167,640
|
460,884
|
533,129
|
-72,244
|
|
2014
|
253,708
|
149,615
|
403,323
|
438,684
|
-35,361
|
|
2015
|
137,930
|
166,853
|
304,783
|
389,240
|
-84,457
|
|
2016
|
86,756
|
294,545
|
381,300
|
398,232
|
-16,932
|
|
2017
|
144,885
|
257,009
|
401,894
|
404,649
|
-2,756
|
|
2018*
|
164,216
|
291,300
|
455,516
|
421,772
|
33,744
|
|
Total
|
1,792,231
|
1,690,078
|
3,482,310
|
3,860,962
|
-378,653
|
G = government spending, T = Net tax revenues
A. Using data in Table 3, comment on the government balance ( T - G) of the UAE government Budget
B. The following two graphs, show composition of UAE government revenues and spending in 2018
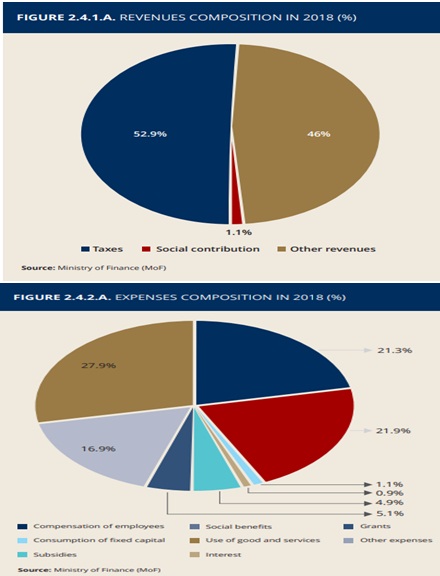
From the two figures, describe TWO main components of government revenues and 3 main component of government the UAE budget in 2018
Revenues:
i.
ii.
Spending
iii.
iv.
v.
Question 11
This question is about how to use G (or ΔG) to influence output (or ΔY).
A. From the co assumption function, Interpret the value of Marginal Propensity to Consume (MPC = 0.2184, or 21.84%)
B. Calculate the spending multiplier and interpret it
C. Calculate the tax multiplier and interpret it
D. Based on your calculations in 2 and 3, do you suggest that the government uses spending (G) or Taxes (T) to stimulate the economy in the UAE and why?
E. Assume that that the government increased its spending by AED50 billion (increase in spending G, or ΔG). Calculate the expected increase in output (ΔY) as a result of this increase in G?
F. If population is about 10 million people, how much would be the increase in GDP per capita as a result of this AED50bn increase in G?
Attachment:- Macroeconimcs.rar