Reference no: EM132396541 , Length: 8
ECMT2130 Financial Econometrics, University of Sydney Australia
Assignment
For this project, you will analyze the behaviour of 10 stocks listed on the Australia stock market to make calculations and answer questions. The project has two stages. The first stage is a data work, for which you will choose the stocks and make basic return calculations. In the second stage, you calculate summary statistics, and write up a short discussion about your data. You will make formal portfolio theory calculations and run regressions for some tests. Your answers should be typed.
1 Preliminary Data Work
1. We collect price data for 10 stocks listed on the Australian stock market over the period from December 2008 to December 2018. You will also collect price data for a broad market index (e.g., the ASX 200) and yield data for a government bond.
(a) Go to the Yahoo Finance.
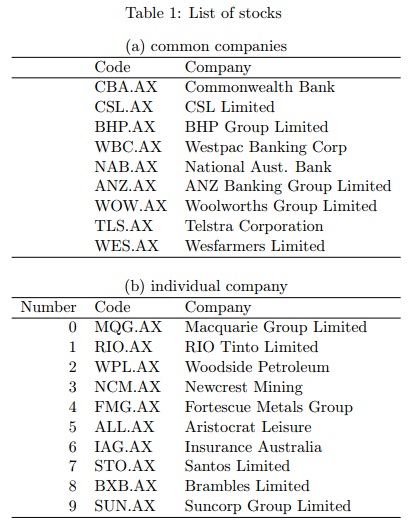
(b) You need to have 10 risky stocks with 9 stocks from (a) common companies and one stock from (b) individual company in Table 1. The last digit of your SID number determines the 10th stock from (b) individual company in Table 1. For example, if you SID is 47033566, you select Insurance Australia (IAG.AX) in number 6.
(c) In the Enter Symbol box at the top, type the symbol of the stock for which you want data. For example, the symbol for Commonwealth Bank in CBA.
(d) Record the current market capitalization (\Market Cap").
(e) On the left, under Quotes, click on Historical Prices.
(f) In the SET DATE RANGE box, select monthly and change the start date to December 31, 2008 and the end date to December 31, 2018. Click Get Prices.
(g) This will bring up the table with price data for the selected time period. Make sure that the data are available at the beginning of the sample period.
(h) At the bottom of the screen, select Download to Spreadsheet. Change the name of the file to the symbol name (e.g., cba.csv). (Note: csv stands for comma separated value file, which is easily read by Excel.)
(i) Open the Excel file. The file will have the price data in descending order (most recent data is at the top). You will want the data in ascending order. To do this, highlight all of the data (including column headers). Then, select Data/Sort, which brings up the Sort dialogue box. The default should have sort by date with ascending order selected.
If so, click OK. Otherwise, select those options and then click OK.
(j) Save the file. Note that the data you will use in the project are the Adj. Close data.
(k) When you have done this for 10 stocks, do the same for the market index. The symbol for the ASX 200 is \AXJO". Name the file \axjo.csv". You can also find it by selecting ^ the Indices link from the initial Yahoo! Financial Quotes page. (As with individual stocks, make sure to use adjusted price measure that includes dividends.)
(l) Finally, you will need data for the risk-free asset. Again, you can get data from the FRED. You want yield data for the 3-month bill yield. For this series, you only need data from January 2009 to December, 2018. Name the file \tbill.csv".
2. [Return Calculations]
The next thing to do is to calculate continuously compounded returns for the ten stocks, the market index, and the risk-free rate. For the price data, the procedure is standard. Compute the continuously compounded monthly returns ln(Pt=Pt-1). (Note: you will not have a return
for Dec. 2008. The first return will be for Jan. 2009.)
For the risk-free rate, the given data is not price data, but annualized percentage yields. To convert to a continuously compounded return, you need to first divide by 100 to get the yield as a decimal. Then, take the natural log of (1+yield). Finally, you can convert to a monthly continuously compounded return by dividing by 12.
Also, construct an equalweighted portfolio for your 10 stocks (i.e., construct a return series that is an equal-weighted average of the returns for the 10 stocks) and a value-weighted portfolio for your 10 stocks (i.e., construct a return series that is a weighted average of the returns for the 10 stocks, where the weights are proportional to the current Market Cap for each firm). For the value-weighted portfolio, a specific firm's implicit weight is its market cap divided by the sum of the market caps for all ten firms (collect all ten market caps on the same day).
2 Proposal
1. [Summary Statistics]
(a) Compute time plots of each of the 12 return series (the 10 individual stock returns and the equal-weighted and value-weighted returns). When reporting plots for each return, report along with ASX200 return and risk-free return on each graph. Also, report the Market Cap numbers for each firm and the corresponding weights used in constructing the value-weighted return series. Provide time plots of the data but try to convey this information in an efficient way by having multiple panels in a given figure. If there are large outliers for any of the series, try to determine what happened at the time. Please include this material in your final project too.
(b) Compute histograms for each of the 14 series (the 10 individual stock returns, the equaland value-weighted returns, the ASX 200 return, and the risk-free return). Do they look Normal? Provide histograms. Make the presentation of graphs as concise as possible (i.e., use multiple panels per page).
(c) Compute mean, variance, standard deviation, skewness, and kurtosis for each of the 14 series. Report kurtosis (not excess kurtosis). (Note: Usually, we think of a normal distribution as having a kurtosis of 3. For reporting purposes use the standard definition of kurtosis. )
If the mean is negative for any of the series, compute the median. Is the median positive?
If so, why do you think there is a difference between the mean and median? Also, compare the standard standard deviations of the other 13 series to the standard deviation of the ASX 200 return series. Provide tables reporting the summary statistics.
(d) Compute the (10x10) sample covariance matrix for 10 return series for the individual stocks.
(e) Compute the Sharpe Ratio for the 10 return series for the individual stocks and for the ASX 200. You can use the average t-bill yield to proxy for the risk-free rate in these calculations. This is equivalent to using the mean excess return for each stock to estimate its risk premium. For the mean returns, use the median estimate if the excess mean based on the sample average is negative. If it is still negative for the median estimate, set the excess mean to zero.
2. [Test for Random-walk]
For individual stocks, i = 1,.....,10, you want to test H0 : φi = 1 for
ln(Pi,t) = αi + βi × t + φi ln(Pi,t-1) + ei,t ei,t ∼ iid(0, σ2) ........ (1)
Equivalently,
Δ ln(Pi,t) = αi + βi × t + γi ln(Pi,t-1) + ei,t, ei,t ∼ iid(0, σ2) ......... (2)
Construct t-statistics for H0 : Φi = 1( or γi = 0). To do this, you will need to calculate the OLS standard error. Show the t-statistic for each stock. Would you reject the null hypothesis using a 5% critical value for a one tailed test? Note that the distribution for this test statistic is different from Student-t distribution and use the critical value for the 5% test of -3.41.3 Discuss.
3. [Portfolio Theory Calculations]
(a) Using the estimated means and the sample covariance matrix, compute the global minimum variance portfolio for the 10 risky assets.
(b) Using the highest historical mean among 10 stocks as a target, compute a second efficient portfolio.
(c) Using the two efficient portfolios computed in a. and b., compute the Markowitz bullet (portfolio frontier for 10 risky assets).
(d) Using the mean monthly risk-free return, compute the tangency portfolio and the efficient set for the 10 risky assets and a risk-free asset.
(e) Compare weights to the weights for the value-weighted portfolio based on current market capitalization. Discuss why you might expect the weights to be related and why you might expect the weights to be different. (Hint: think about when the market capitalization is measured.)
4. [CAPM Estimations]
(a) Using the risk-free rate data, calculate excess returns. Run the CAPM regression for each stock.
(b) For each stock, test the hypothesis that the intercept term αi = 0 versus the alternative that it does not. Again, use a 5% test. Also, calculate the 95% confidence intervals for the alphas.
(c) Test the CAPM by running a CAPM regression with the excess return on your tangency portfolio as the dependent variable (instead of the return on a given asset, as in part b.). Is α = 0?