Reference no: EM132314889
Statistical Techniques Assignment -
Note: All questions are compulsory. Answer in your own words.
Q1. State whether the following statements are true or false and also give the reason in support of your answer:
a) In a sequence of random numbers, generated through LCG" xi = (12xi-1 + 6) Mod 11 with x0 = 06 the x1, x2 and x3 will be 11, 17, 12.
b) The probability of selection of a sample of n from the population by SRSWOR is 1/N.
c) While analysing the data of a 4 × 4 Latin Square design the error d.f. is equal to 10.
d) In a Two way analysis of variance with 5 blocks & 5 treatments the degree of freedom for the total variation is 14.
e) Suppose a random number generated by Middle. Square Method is 15, then the next random number will be 22.
Q2. A sample of 100 employees is to be drawn from a population of collages A and B. The population means and population mean squares of their monthly wages are given below:
|
Village
|
Ni
|
x-i
|
Si2
|
|
Collage A
|
400
|
60
|
20
|
|
Collage B
|
200
|
120
|
80
|
Draw the samples using Proportional and Neyman allocation techniques and compare. Obtain the sample mean and variances for the Proprtional Allocation and SRSWOR for the given information. Then Find the percentage gain in precision of variances of sample mean under the proportional allocation over the that of SRSWOR.
Q3 a) In a class of Statistics, total number of students is 30. Select the linear and circulur systematic random samples of 10 students. The age of 30 students is given below:
Age: 22 25 22 21 22 25 24 23 22 21 20 21 22 23 25 23 24 22 24 24 21 20 23 21 22 20 20 21 22 25
b) To determine the yield rate of wheat in a district of Punjab, 6 groups were constructed of 6 plots each. The data is given in the following table:
|
Plot No.
|
Group 1
|
Group 2
|
Group 3
|
Group 4
|
Group 5
|
Group 6
|
|
1
|
8
|
6
|
18
|
13
|
17
|
12
|
|
2
|
13
|
5
|
8
|
7
|
15
|
15
|
|
3
|
11
|
16
|
6
|
13
|
10
|
11
|
|
4
|
26
|
5
|
10
|
6
|
21
|
17
|
|
5
|
13
|
16
|
16
|
7
|
20
|
8
|
|
6
|
31
|
5
|
20
|
2
|
25
|
10
|
Select a cluster sample of 3 clusters from the given data and find sample mean.
Q4. Three varieties A, B and C of wheat are shown in five plots each of the following fields per acre as obtained:
|
Plots
|
A
|
B
|
C
|
|
1
|
40
|
35
|
60
|
|
2
|
50
|
25
|
45
|
|
3
|
35
|
50
|
65
|
|
4
|
70
|
45
|
60
|
|
5
|
55
|
45
|
70
|
Set up a table of analysis of variance and find out whether there is significant difference between the fields of these varieties.
Q5. The heights of the trees are given in the table given below for an experiment involving six treatments in four randomised blocks. The treatments are indicated by numbers with brackets:
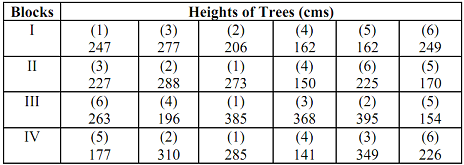
Analysis the data using suitable design and draw the conclusion.
Q6. The following table gives the layout and the results of a 23 factorial design laid out in four replicates:
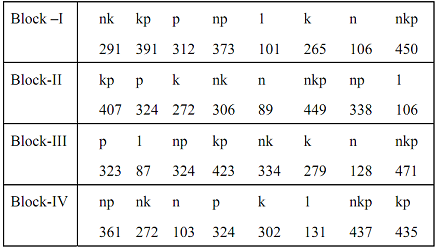
Determine the effect the 3 kinds of fertilizer; Nitrogen N, Potash K and phosphate P on potato crop yield.
Q7. Four doctors each test four treatments for a certain disease and observe the number of days each patient takes to recover. The results are as follows (recovery time in days)
|
Doctor
|
Treatment
|
|
1
|
2
|
3
|
4
|
|
A
|
10
|
14
|
19
|
20
|
|
B
|
11
|
15
|
17
|
21
|
|
C
|
9
|
12
|
16
|
19
|
|
D
|
8
|
13
|
17
|
20
|
Determine whether there is significant difference in terms of (i) doctor's and (ii) treatments.
Q8. a) Generate a complete cycle for the LCG given xi = (5x(i-1) + 3) Mod(16), with x0 = 5''. A man tosses an unbiased coin 10 times. Using the first 10 random numbers generated above, obtain a sequence of heads and tails.
b) Following U(0,1) were generated by a random number generation method:
|
0.251
|
0.769
|
0.153
|
0.575
|
0.390
|
0.335
|
0.066
|
0.104
|
0.200
|
|
0.019
|
0.597
|
0.729
|
0.012
|
0.922
|
0.691
|
0.817
|
0.064
|
0.539
|
|
0.419
|
0.305
|
0.449
|
0.998
|
0.919
|
0.470
|
0.372
|
0.851
|
0.643
|
|
0.509
|
0.913
|
0.445
|
0.464
|
0.447
|
0.279
|
0.413
|
0.494
|
0.972
|
|
0.983
|
0.432
|
0.368
|
0.574
|
|
|
|
|
|
Apply chi-square test to test the fit the distribution.
|
Find the total labor cost variance
: Budgeted 5 hours of labor per unit at $11.00 per hour.Units completed 8,500, Completed in 40,500, Total labor costs $469,800.
|
|
Describe the type of clustering that is used
: After reading Chapter 4 in the textbook, please complete the following discussion requirements: Identify an opportunity or example that makes use of clustering
|
|
What is net cash flow from investing
: Hupta Corporation reports for the year ended December 31, 2005, sales of $9,430 and cost of goods sold of $6,500. Other information as of December 31.
|
|
Reasons why ids would benefit the company
: After reviewing your latest submission, the CIO has found some areas of concern and would like you to provide a little clarity on one subject.
|
|
Draw the samples using neyman allocation techniques
: MST-005: Statistical Techniques Assignment - Draw the samples using Proportional and Neyman allocation techniques and compare
|
|
What is a vpn and what technologies are used to create one
: How are authentication and authorization alike and how are they different. What is the relationship,if any,between the two? What is a VPN and what technology.
|
|
Discuss each step and outcome of time series analysis
: Part of the time series analysis process includes having to clean or transform the data. For this assignment, you will be using SAS Studio Forecasting tasks.
|
|
Define top rated digital asset management software products
: Do research online to identify the capabilities of digital asset management software. What are the top rated digital asset management software products?
|
|
Describing a potential computer security problem
: Please identify a computer system you have recently had experience with (at home, work,etc.); prepare an attached PowerPoint presentation (minimum 8 slides).
|