Draw the open-loop bode plot of the frequency response

Assignment Help Electrical Engineering
Reference no: EM13891307

Analyze and design a boost converter and its controller given the following specifications:

An input voltage of 20V < Vin < 30V and an output of Vout = 50V over a load range of 10W < Pout < 100W. Switching frequency is fsw = 250kHz.

Hardware Design

1) Design the inductor (L) and capacitor (C). The current ripple ΔiL should be below 5% of the average inductor current IL at the maximum load under any Vin. The steady state ripple ΔVout is below 2% of the steady-state value of the output voltage. For the designed L, find the value of Iout,crit at the boundary of DCM and CCM. Plot Iout,crit vs. Vin.

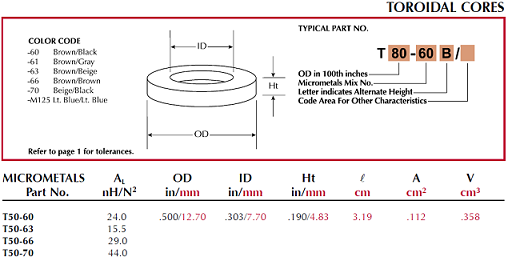
2) For designed L, suppose there are four cores available listed below, select the core size to use the space maximum, design the inductor's number of turns N and the wire (use American wire gauge table) size.

132_Analyze and design a boost converter.png

Steady-state Analysis

3) Analytically determine and draw the expected current and voltage waveforms for each component in your circuit at both light and heavy load.

4) Using PSpice/Matlab software, simulate the circuit under the heavy and light load conditions (provide schematic of the whole system). Plot the voltage and current of each component within 3 to 5 switching periods in the steady-state. Validate that the output of your simulation matches your analytical calculations in (2).

Modeling and Controller Design

5) Based on your designed circuit, considering the parasite resistance of the inductor r is 0.2Ω, using the average state-space method and small-signal technique to the transfer function v~o(s)/d~(s). Draw the open-loop bode plot of the frequency response (with matlab/pspice, not hand drawing).

6) Design a proportional-integral (PI) controller (recommend to use matlab siso toolbox) so that phase margin of the loop transfer function should be over 35o, and the crossover frequency is no larger than 10kHz. Provide the close loop bode plot (with matlab/pspice).

System Simulation

7) Using PSpice/Matlab software, simulate the designed circuit with controller, 1) Vin = 25 + 5*sin(2Π*60*t), simulate output voltage vo which should be a constant value, plot both Vin and vo in a same figure with time range more than 16.7ms; 2) measure the dynamic of the output voltage together with the disturbance of input or load through designing disturbances in load and input voltage. a) input voltage disturbances: Vin step change from 20V to 30 V; 2) load change from 10W to 100W. [Plot the disturbance, i.e., Vin, Load, and the output voltage of the converter in a same figure]

Write a report that documents that describes your results and observations from parts (1)-(7). Make sure all plots are well labeled and that explanations contain solid analytical foundations.

Make sure the figures are organized, neat and easy to be read and they are drawn by the software not by hand. Do NOT plot one graph per page.

Reference no: EM13891307

Questions Cloud

Identify pros and cons of complying with customers requests : Identify the pros and cons of complying with the customer's request, and state the recommendation you would make to your sales manager.
Noncommercial recreation activity or attraction : 1) Choose one commercial and one noncommercial recreation activity or attraction, and discuss their similarities and differences. Be sure to include differences in management styles and customer service.
Find a scholarly article related to corporate social : find a scholarly article related to Corporate Social Responsibility
The clinical intervention, including its key principles : The clinical intervention, including its key principles and ideas. For example, if you are proposing a clinical intervention using Reality Therapy, briefly describe the five basic needs
Draw the open-loop bode plot of the frequency response : Design a proportional-integral (PI) controller (recommend to use matlab siso toolbox) so that phase margin of the loop transfer function should be over 35o, and the crossover frequency is no larger than 10kHz. Provide the close loop bode plot (with..
Calculate break-even point expressed in terms of total sales : Calculate the break-even point expressed in terms of total sales dollars and sales volume. Calculate the margin of safety and the margin of safety ratio. Assume current sales are $75,000.
Describe the drivers for causing haier to shut down : Describe the drivers for causing Haier to shut down the company's central warehouse
What does the first line state : 1. What does the first line state? What evidence is given in the article to support this statement? 2. What two factors are listed as the biggest threats to biodiversity?
How did you score on life factors : How did you score on Life Factors? How did Life Factors impact your semester (in this and all classes?). How can you keep life factors from being as big of a factor in future semesters (or can you?)

Reviews

Write a Review

Electrical Engineering Questions & Answers

  Lithium ion battery technology

The paper includes Lithium ion battery technology with its advantages and disadvantages. The paper discusses about the Lithium air battery in which detailed reactions of Lithium with air including nonaqueous as well as aqueous are given.

  Power transformers and tariffs

Construction of different types of power transformer, significant energy savings

  Paper on orthogonal frequency-division multiplexing

This document is shown a paper on Orthogonal frequency-division multiplexing with advantages, disadvantages and uses.

  Function of the hmi in a scada system

This assignment contains electronics engineering questions like State the commonly found components of a SCADA (Supervisory control and data acquisition) system. and decribe the function of the HMI in a SCADA system.

  Resultant waveform of the odd harmonic series

Prepare an Excel graph showing the individual components and summated resultant waveform of the odd harmonic series resulting in an approximate square wave.

  Explain scada system

Explain the function of the HMI in a SCADA system.

  Design a 2-digit 24 second shot-clock

Design a 2-digit 24 second "shot-clock" countdown timer with pushbutton controller.

  Model a discrete-time system

To understand di erent signal models To be able to model a discrete-time system and design simple signal processing algorithms.

  Draw a relay construction diagram

Draw a relay construction diagram and briefly explain the operation of a relay.

  Frequency division multiplexing

Write a short technical report on Frequency Division Multiplexing

  Impact of electron energy

Briefly discuss the impact of electron energy, electron current and target on the Bremsstrahlung generated.

  Traffic light controller

The schematic of the traffic light controller

Free Assignment Quote

Assured A++ Grade

Get guaranteed satisfaction & time on delivery in every assignment order you paid with us! We ensure premium quality solution document along with free turntin report!

All rights reserved! Copyrights ©2019-2020 ExpertsMind IT Educational Pvt Ltd