Reference no: EM131332400
1. Draw the graph of the following linear function and give the domain and range.
f(x) = -½x + 5
2. Solve the following equation.
|x| = 3.
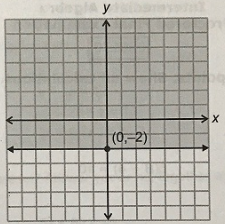
3. Give the inequality whose graph is shown below.
4. Evaluate the following expression when x = 3 and y = 2.
2xy - x2y
5. Completely factor the following expression.
16x4 - 81y4
6. Perform the following division.
(y2 + 10y + 21) ÷ (y + 7)
7. Solve the inequality below and write the solutions in interval notation.
|2m + 3| < 13
8. Write the numeral 0.0685 in scientific notation.
9. Given f(x) = -6x - 1, find f(2).
10. Write the equation of the line with a slope of 2 and passing through the point (-5, 3).
11. Simplify the following expression completely:
(ab-3/3a-2b2)2
12. Solve the system of equations given below.
x + 3z = 12
-x - 2y + z = 10
3x + 5y + 2z = -7
13. Do the following two lines intersect? Answer yes or no, together with the point of intersection; if any
5x - 8y = -5
-x - 1.6y= 14
14. Compute the determinant.
4 0 -1
3 6 -2
-2 5 1
15. Compute the distance between the two points (1- √2, -1) and (2 +√2, 4).
16. Rationalize the denominator of (2√7)/(x+√7).
17. At what x values does the parabola y = x2- 5x + 4 intersect the x axis?
18. The surface area (A) of a sphere with radius (r) is given by A = 4πr2. Solve this formula for r.
|
Describe the situation as an extensive form game
: Describe this situation as an extensive-form game, where the root of the game tree is a chance move that determines Henry's type.
|
|
Prepare in good form a statement of net position
: Prepare, in good form, a Statement of Net Position for Southern State University as of June 30, 2015. Record the increase in the present value of the receivable in the temporarily restricted net asset class as of December 31.
|
|
Presented in graph or table format
: Using the Internet, the text, or another reliable source such as a newspaper or periodical site, (not a scholastic or school site like Khan Academy and not Wikipedia), research some important data that has been presented in graph or table format. ..
|
|
Is it important that you understand how to use statistics
: Is it important that you understand how to use statistics? Why, or why not? How are statistics used in your field of study?What is the difference between descriptive and inferential statistics?List several examples of descriptive statistics and infe..
|
|
Draw the graph of the given linear function
: Draw the graph of the following linear function and give the domain and range. Solve the inequality below and write the solutions in interval notation
|
|
Mutually exclusive projects-what is mirr of better project
: Your company is considering two mutually exclusive projects, X and Y, whose costs and cash flows are shown below: Year Project X Project Y 0 ($2,000) ($2,000) 1 200 2,000 2 600 200 3 800 100 4 1,400 100 The projects are equally risky, and their cost ..
|
|
Displayed in front of the dealership
: A car dealership has 8 red, 13 silver and 5 black cars on the lot. Ten cars are chosen randomly to be displayed in front of the dealership.
|
|
Find evidence of positive autocorrelation
: a. Fit a simple linear regression model by ordinary least squares and obtain the residuals. Also obtain s{b0} and s{b1}. b. Plot the residuals against time and explain whether you find any evidence of positive autocorrelation.
|
|
What is effective annual rate on this loan
: if you are choosing to invest in the stock market, what stocks would you choose? Why? Are the criteria you are using quantitative or qualitative? You have a car loan with a nominal rate of 6.25 percent. With interest charged monthly, what is the effe..
|