Reference no: EM13121279
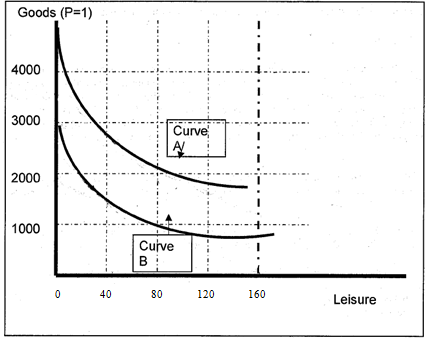
1. We know that Reginald has the two indifference curves depicted in Figure 1. Given these curves, please answer the following questions.
a) Assuming 0 nonwage income and a 160 hour week, at about what hourly wage rate will Reginald be in equilibrium on indifference Curve A?
b) Assuming 0 nonwage income and a 160 hour week, at about what hourly wage rate will Reginald be in equilibrium on indifference Curve B?
c) Does Reginald's labor supply curve slope forwards or back in this range? Why?
d) Suppose Reginald gets the wage in (b). About how much nonwage income must Reginald get to be indifferent between that wage and the wage in (a)?
e) In approximate terms, what is the income effect and substitution effect (in hours) when increasing wages from that in (b) to that in (a)?

2. Once upon a time there was a country that had no taxes. Viewing this as unacceptable for a modern state, the king decreed the following tax system:
All people with annual earnings under $30,000 per year will pay no tax. All people with annual earnings over $30,000 will pay a tax of 50% on earnings greater than $30,000.
Now, consider a lawyer with a wage of $20 per hour.
A. Draw an goods-leisure diagram of how this new tax system changes the lawyer's budget constraint. Be sure to label your axis.
B. What would be the predicted effect of the new tax system on the labor supply of a lawyer who works more than 2000 hours per year? If applicable, be sure to talk about income and substitution effects. (You do not have to diagram these effects.)
In your analysis, assume
1. Lawyers in this land have choice over their hours.
2. "Leisure" is a normal good.
3. Indifference curves are the usual shape.
4. Ceteris paribus, i.e., at the time the tax system is introduced nothing else (wage rates, nonwage income, tastes) change.
3. Jones is a little bit lucky and a little bit unlucky. She was lucky when she won a lawsuit, and was paid $400 per month by her former partner. She was unlucky when, on the same day, her employer decreased her hourly wage from $15 per hour to $10 per hour.
A. Draw a goods-leisure diagram of how these two events alter Jones' budget constraint. (Assume Jones has no nonlabor income.) (This means you should draw her budget constraint before today and after today.)
B. If Jones was previously working 80 hours per month, what would be the predicted effect of the change in the budget constraint. Your answer should include (at least) a discussion of income and substitution effects.
Use assumptions similar to those in question 2.
4. Sally can work up to 3,120 hours each year (a busy social life and sleep take up the remaining time). She earns a fixed hourly wage of $25. The government begins to levy both a payroll tax and an income tax with the following structure: Sally owes a 10 percent payroll tax on the first $40,000 of earnings. Above $40,000 there is no payroll tax. Sally also faces a progressive income tax. There is no income tax on the first $10,000 of income. From $10,000 to $60,000 the marginal income tax rate is 25%. Above $60,000 the marginal tax rate in 50%. Graph Sally's budget constraint. Analyze the effects of this tax system on Sally's labor supply, as compared to a no tax world.
5. Draw the budget constraint for a world with both fixed time costs and fixed money costs of working. What is the effect of fixed costs on the reservation wage? the probability of working, ceteris paribus? If fixed costs increase, what will happen to the average wage rate of workers? (For the last question, think about if more or less people are working. What are the wages like for those who are still working? So what happens to the average wage when the fixed costs increase?)