Reference no: EM13851834
1. Draw and find the area under the standard normal curve:
a. To the left of
b. To the right of
c. Between and
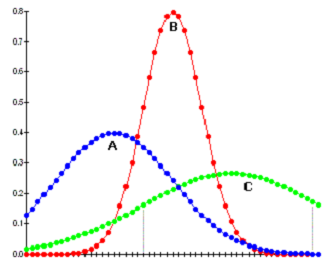
2. Which normal curve has the greatest mean and standard deviation? And which normal curve has the smallest mean and standard deviation?
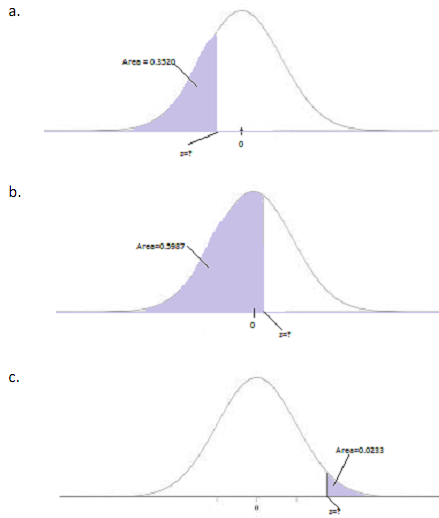
3. Find the indicated z-score(s) shown in the graph:
4. The time per workout an athlete uses a stairclimber is normally distributed with a mean of 20 minutes and a standard deviation of 5 minutes. An athlete is randomly selected
a. Find the probability that the athlete uses a stairclimber for less than 17 minutes.
b. Find the probability that the athlete uses a stairclimber between 17 and 22 minutes.
5. You write the population values {1,3,5,7} on slips of paper and put them in a box. Then you randomly choose two slips of paper, with replacement. List all possible samples of size n=2 and calculate the mean of each. Then form the sampling distribution of the sample means. Find the mean of the sample means. Compare your result with the mean of the population.
|
Compute the variable cost per unit
: Compute the variable cost per unit. Compute el costo variable por unidad? Compute how many CDs that MARCARIE will have to sell in order to break even.
|
|
Two methods of filling cereal boxes are being compared
: Two methods of filling cereal boxes are being compared. Both methods fill the box with the same amount of cereal on average so the company wants to select the method with the lower variance. At the 5% level of significance, does it appear that the va..
|
|
Class working definition of environment
: 1. Explain this class's working definition of "environment." 2. Should all humans be concerned about environmental issues? Why/why not?
|
|
State and explain the central limit theorem
: State and explain the Central Limit Theorem
|
|
Draw and find the area under the standard normal curve
: Draw and find the area under the standard normal curve - Find the indicated z-score and Which normal curve has the greatest mean and standard deviation? And which normal curve has the smallest mean and standard deviation?
|
|
Examiner office for a major metropolitan
: Imagine that you work at the medical examiner's office for a major metropolitan city. As Chief Medical Offi cer, you investigate suspicious deaths and provide toxicology services for the county. Unfortunately, it's been a busy week. In the past fi..
|
|
Relative prices Use exchange rate to make the conversion
: How large is the economy of Japan? Japanese GDP in 2010 was 480 trillion yen (U.S. GDP, again was $14.5 trillion). The exchange rate in 2010 was 87.8 yen per dollar. What is the ratio of Japanese GDP to U.S. GDP if we don't take into account the diff..
|
|
Calculate resulting cash flow and state nature of cash flow
: Calculate the resulting cash flow and state the nature of cash flow namely, operating, investing and financing. Acquired machinery for ?2,50,000 paying 20% down and executing a bond for the balance amount.
|
|
Trying to sell your audio system
: You are trying to sell your audio system (an amplifier and speakers) to raise money for an upcoming trip to overseas. The system works great, and audiophile friend tell you that if he were in the market for this kind of equipment (which he isn’t), he..
|