Reference no: EM131404634
The average August temperatures (y) and geographic latitudes (x) of 20 cities in the United States were given in the table for given Exercise. (The data are part of the temperature dataset on the companion website.) The regression equation for these data is
y^ = 113.6 - 1.01x
a. What is the slope of the line? Interpret the slope in terms of how the mean August temperature is affected by a change in latitude.
b. Estimate the mean August temperature for a city with latitude of 32.
c. San Francisco has a mean August temperature of 64, and its latitude is 38. Use the regression equation to estimate the mean August temperature in San Francisco, and then calculate the prediction error (residual) for San Francisco.
Exercise
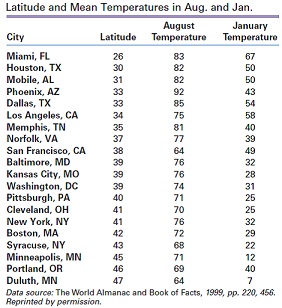
The data in the following table are the geographic latitudes and the average August and January temperatures (Fahrenheit) for 20 cities in the United States. The cities are listed in geographic order from south to north. (These data are part of the temperature dataset on the companion website.)
a. Draw a scatterplot of y = August temperature versus x = latitude.
b. Is the pattern linear or curvilinear? What is the direction of the association?
c. Are there any cities that appear to be outliers because they don't fit the pattern of the rest of the data? If so, which city or cities are they?
|
What is the estimated average height of women
: Interpret the slope of 0.7 in terms of how height changes as hand span increases.- What is the estimated average height of women with a hand span of 20 cm?
|
|
Draw up a two-way table for these figures with rows
: Draw up a two-way table for these figures with rows for the types of booking and columns for the length of stay. Deduce the figures that are not given by using the information provided
|
|
Construct a two-way tabulation with rows for the city areas
: Construct a two-way tabulation with rows for the city areas and columns for the method of payment. Work out the figures that are not quoted in the summary by using the information provided
|
|
Devise a plan to investigate the validity of patients claim
: As the head health care administrator at USA Community Hospital, you are required to review compliance reports on issues relating to the ethical conduct of the professional staff at your hospital, patient review registries, and standard procedures..
|
|
Draw a scatterplot of y versus x
: Draw a scatterplot of y = August temperature versus x = latitude.- Is the pattern linear or curvilinear? What is the direction of the association?
|
|
Derive an individual player payoff function
: Derive an individual player's payoff function (i.e., the expression that gives us a player's payoff as a function of her strategy profile.) How many drivers will there be on both types of roads in a Nash equilibria
|
|
Evaluation of the six sections of the mapp framework
: Using the NACCHO link, review each section of the Mobilizing for Action through Planning and Partnerships (MAPP) framework. Using the same public health issue from previous weeks (Drug Abuse), develop a hypothetical program that will address that ..
|
|
Describe statistical or deterministic relationship
: The equation for converting a temperature from x = degrees Celsius to y = degrees Fahrenheit is y = 32 + 1.8x. Does this equation describe a statistical relationship or a deterministic relationship? Briefly explain your answer.
|
|
Determine the mode and median of this distribution
: Calculate the mean of the distribution and compare it to the mode and median. What can you conclude about the shape of the distribution?
|