Reference no: EM132883832
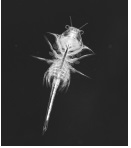
Question 1 The photograph shows a brine shrimp, Artemia salina.
Magnification ×2.0
Brine shrimps are invertebrate animals that live in salt lakes. They feed on algae and reproduce by producing eggs.
When the conditions are favourable, the eggs hatch into brine shrimps.
A student observed that eggs hatched faster when calcium ions were added to the saltwater.
(a) Describe an experiment to investigate the effect of calcium ion concentration on the time taken for brine shrimps to hatch.
(b) (i) State two abiotic variables, other than the independent variable, that could affect this experiment.
First variable
Second variable
(b) (ii) Choose one of the variables you have identified in (b)(i).
Explain how this variable could be controlled.
Describe what effect it could have on the results if it is not controlled.
How this variable is controlled.
(c) Calcium ions can bind to some enzymes.
Explain how the presence of calcium ions can affect the time taken for brine shrimp eggs to hatch.
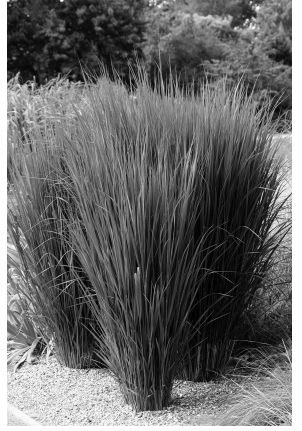
Question 2 The photograph shows switchgrass, Panicum virgatum.
This plant is grown on many farms in North America. It produces a large biomass that can be used to generate electricity or food for farm animals.
A scientist investigated the biomass produced by two different varieties of switchgrass, Almo and Kanlow.
One field was divided into twenty plots of the same area.
Ten of these plots were planted with seeds of the variety Almo and the other ten plots were planted with seeds of the variety Kanlow.
All the plots were planted with the same density of seeds. All the plots were harvested by machine on the same day. This was repeated each year for seven years.
The notebook shows the results of this investigation.
(a) Write a suitable null hypothesis for this investigation.
(b) (i) State the meaning of the term biomass.
(ii) When burnt, switchgrass biomass releases 14.25 MJ kg-1 of energy.
Calculate the energy released from burning all the Kanlow biomass produced in year four.
Give your answer to two significant figures, using standard form.
(iii) Draw a suitable table to display the results of this investigation. Label the median for both varieties of switchgrass.
(c) Draw a graph to show the median biomass for each variety of switch grass. Include an indication of the variability of the data.
d) The scientist used a Mann-Whitney U test to analyse
the data. The following formulae were used.
Where n1 and n2 are the number of samples of each switchgrass. The scientist calculated the value of R1 = 57.5 and R2 = 47.5
The value of U1 = 29.5
(i) Calculate the value of U2.
(ii) The table shows the critical value of U for probability value of p = 0.05.
For the difference to be significant, the smallest calculated U value has to be equal to, or less than, the critical value shown in the table.
(e) Explain why it may not be reasonable to draw a valid conclusion from the method used in this investigation and the results obtained.
Question 3 The photograph shows a sea slug of the genus Aplysia, a marine animal.
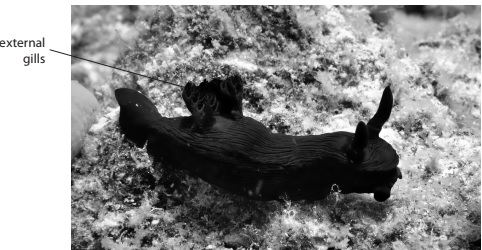
Aplysia can be kept in tanks in a laboratory. Aplysia absorb oxygen using external gills.
When the gills are touched, the gills are completely withdrawn into the body by a reflex action.
The gills re-emerge after some time.
The student formed the following hypothesis:
The more frequently the gills are touched the less time it takes them to re-emerge. Plan an investigation to find evidence to support or reject this hypothesis.
(a) Describe preliminary practical work that you might undertake to ensure your proposed method would provide quantitative results.
(b) Devise a detailed method, including an explanation of how you would control and monitor important variables.
(c) Describe how your results should be recorded, presented and analysed, in order to draw conclusions from your investigation.
(d) Suggest four limitations of your proposed method.
Attachment:- Biology WB.rar