Reference no: EM13883878
Project Description:
In our class, we model a transmission line as a distributed- parameter RLC circuit, which has a large number of stages that represent segments of the transmission line. In class, we presented the RLC circuit as an L-type equivalent circuit model (characterized with distributed parameters R, G, L, C) for a segment ?z of a line, and gained insight into the transmission line's response characteristics when a sinusoidal source is applied. However, we did not simulate the traveling wave behavior of the response. In this project, you will simulate and examine the traveling wave dynamics of the transmission line using the circuit model.
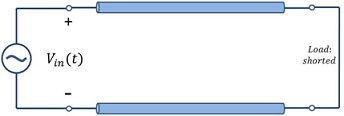
Specifically, in this project, you will consider a 1km (1000m) long transmission line with the following parameters: inductance L of 0.01H/m, resistance R of 0.002?/m along the line, and capacitance C of 0.01F/m, conductance G of 0.002S/m across the line. The transmission line is driven by the voltage source Vin(t) = sin(2πt), while the end terminal of the line is shorted.

You will simulate a circuit model of the transmission line, in which each circuit stage represents 10m of the transition line (?z = 10m). Notice that this means that the circuit will have 100 stages, or in other words 100 inductors and 100 capacitors (and 200 resistors).
To simulate the model, please do the following:
1. Draw a few stages of the L-type circuit model (please include the first and the last stages).
2. For each stage k (k = 1, ......., 100), write down the two differential equations for the RL and RC parts of the stage, and solve these equations for dik(t)/ d(t), respectively. This process should yield a set of 200 coupled differential equations for the capacitor voltages and inductor currents.
3. Simulate these 200 differential equations using Matlab. You can do this in two ways. One approach is to write all of the differential equations together as a big state-space system (with 200 state variables), and then use Matlab to solve the state- space system as you learned in EE321. Another approach is to choose a discrete time step (e.g., 0.001s), and to update each capacitor voltage and inductor current at that time step. You can do that by approximating the derivatives dik(t)/dt and dvk/dt as first differences (using the definition of a derivative), and then updating the voltages and currents using a "for" loop.
4. Please plot the voltage and current vs time at locations 100m, 500m, and 900m along the transmission line. Also, please plot the voltage and current along the whole transmission line at times 50s, 51s, and 60s.