Reference no: EM131032713
1. NK Model
Consider a NK model with no capital, like the model discussed in Lectures 19 and 20. In this model, households choose their money balances Mt, labor supply Nt, and savings Bt+1 in a nominal bond to solve
(a) As shown in Lecture 19, the household optimality or intratemporal Euler condition for labor supply Nt is given by
1/Ct Wt/Pt = Ntφ.
Interpret this condition in words.
(b) As shown in Lecture 19, the household optimality or intertemporal Euler condition for money balances Mt is given by
1/CtPt = γ1/Mt + βEt[1/Ct+1Pt+1]
Interpret this condition in words.
(c) As shown in Lecture 19, the household optimality or intertemporal Euler condition for savings Bt+1 is given by
1/CtPt = β(1 + it+1)Et[1/Ct+1Pt+1].
Interpret this condition in words.
(d) Using the optimality conditions for Mt and Bt+1, write a money demand equation linking the household's optimal real money balances Mt/Pt to a function of consumption and the nominal interest rate it+1. If the nominal interest rate it+1 increase, do real money balances increase or decrease? Explain the intuition for this in words.
(e) Assume that the equation Mt = ΨPtYt holds for some constant Ψ > 0, i.e. assume that money satisfies a constant velocity equation in this economy. Assume that prices Pt are perfectly fixed in the short run because the prices Pt are set by firms in period t - 1. If there is an unexpected increase in the money supply Mt in period t, use the constant velocity formula to determine whether output Yt increases, decreases, or stays the same. Explain the intuition behind your result in words.
(f) Now, assume that the money supply Mt and the output level Yt grow at constant rates, i.e. that
Mt+1 = (1 + gM)Mt
Yt+1 = (1 + gY)Yt
for some net growth rates gM > gY > 0. Use the constant velocity formula Mt = ΨPtYt to derive a formula for the gross inflation rate Πt+1 = Pt+1/Pt as a function of gM and gY. Then, use the log approximation log(1+ x) ≈ x to write πt+1 = log Πt+1 as a function of gM and gY. If the money growth rate gM increases, does inflation πt+1 increase or decrease?
(g) Using the Fisher equation rt+1 = it+1 -πt+1 as well as your answer to part (f), write the real interest rate rt+1 as a function of the nominal interest rate it+1, the money growth rate gM, and the output growth rate gY. If the money growth rate gM increases, does the real interest rate increase or decrease? If the output growth rate gY increases, does the real interest rate increase or decrease?
2. Optimal Monetary Policy
Consider a central bank's optimal monetary policy problem with discretion as described in Lecture 21. The central bank desires to choose the output gap xt, the inflation rate πt, and nominal interest rates it+1 in each period t in order to optimize their objective

subject to cost-push shocks εts and demand shocks εtd to the economy satisfying
εts = ρs εst-1 + vst, εtd = ρd εdt-1 + vtd
as well as the IS and Phillips curves
xt = -φ (it+1 - Etπt+1) + Etxt+1 + εtd
πt = βEtπt+1 + λxt + εts.
As shown in Lecture 21, the optimal monetary policy under discretion implies that
xt = -λγsεts
πt = αγsεts
it+1 = γπ Etπt+1 + (1/φ)εtd
where γs = (1/ λ2 + α(1-βρs)) > 0, γπ = (1 + (λ(1-ρs)/φαρs)) > 1, and α, λ > 0. Assume that in period t = 0, the cost-push and demand shocks satisfy εts = εtd = 0 and that the central bank is engaging in optimal monetary policy subject to discretion with xt = πt = 0. Then, in period 1, assume that there is a single positive cost-push innovation with υ1s = 1. All other shocks are zero with υts = 0 for t > 1 and υtd = 0 for all t. In other words, assume that the cost-push shock εts increases unexpectedly in period 1 but that no other innovations hit the economy thereafter. Using the formula for εts above, it is possible to show under these conditions that the formula εts = (ρs)t-1 holds for all t = 1, 2, .... If 0 < ρs < 1, then the evolution of the cost- push shock εts as a function of t after the initial shock in period t = 0 must look something like the curve plotted in Figure 1. Note that it must be the case that εts → 0 as t → ∞.
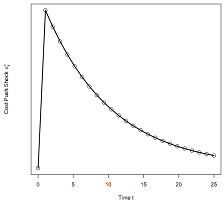
Figure: εts in Response to a Positive Cost-Push Innovation at Time t = 1
(a) Using the formula for εts given above, together with the optimal policy formula for xt given above, draw a curve describing the evolution the output gap xt in response to the positive cost-push innovation in period 1. In period 1, does the output gap xt increase, decrease, or stay the same? Describe the path for the output gap xt after the cost-push innovation in period's t > 1.
(b) Using the formula for εts given above, together with the optimal policy formula for πt given above, draw a curve describing the evolution the inflation rate πt in response to the positive cost-push innovation in period 1. In period 1, does the inflation rate πt increase, decrease, or stay the same? Describe the path for the inflation rate πt after the cost-push innovation in period's t > 1.
(c) Based on your answers in parts (a) and (b), do the output gap and inflation move in the same direction or in opposite directions in response to a cost-push innovation? Explain the intuition behind this result in words.
(d) Assume that the central banker is an extreme "inflation hawk" with α → 0, so that the output gap and inflation coefficients -λγs → - (1/λ) and αλs → 0. Draw figures plotting the responses of the output gap and inflation to the cost-push innovation in period 1. Compare these patterns to the output gap and inflation paths from parts (a) and (b), and explain the intuition behind the differences you see.
(e) Assume that the central banker is an extreme "inflation dove" with α → ∞, so that in the limit the output gap and inflation coefficients satisfy -λγs → 0 and αλs → 1/1-βρs. Draw figures plotting the responses of the output gap and inflation to the cost-push innovation in period 1. Compare these patterns to the output gap and inflation paths from parts (a) and (b), and explain the intuition behind the differences you see.
Attachment:- Assignment.rar